

The Power of 3-7-11 and the Grand Super Cycle: How We Saw the Bullish Turn in April 2025 Back on April 9, 2025, while World Indices were dropping sharply and global sentiment had turned overwhelmingly bearish, we published an article that challenged the fear-driven narrative. We explained why selling was not the right approach and […]
-
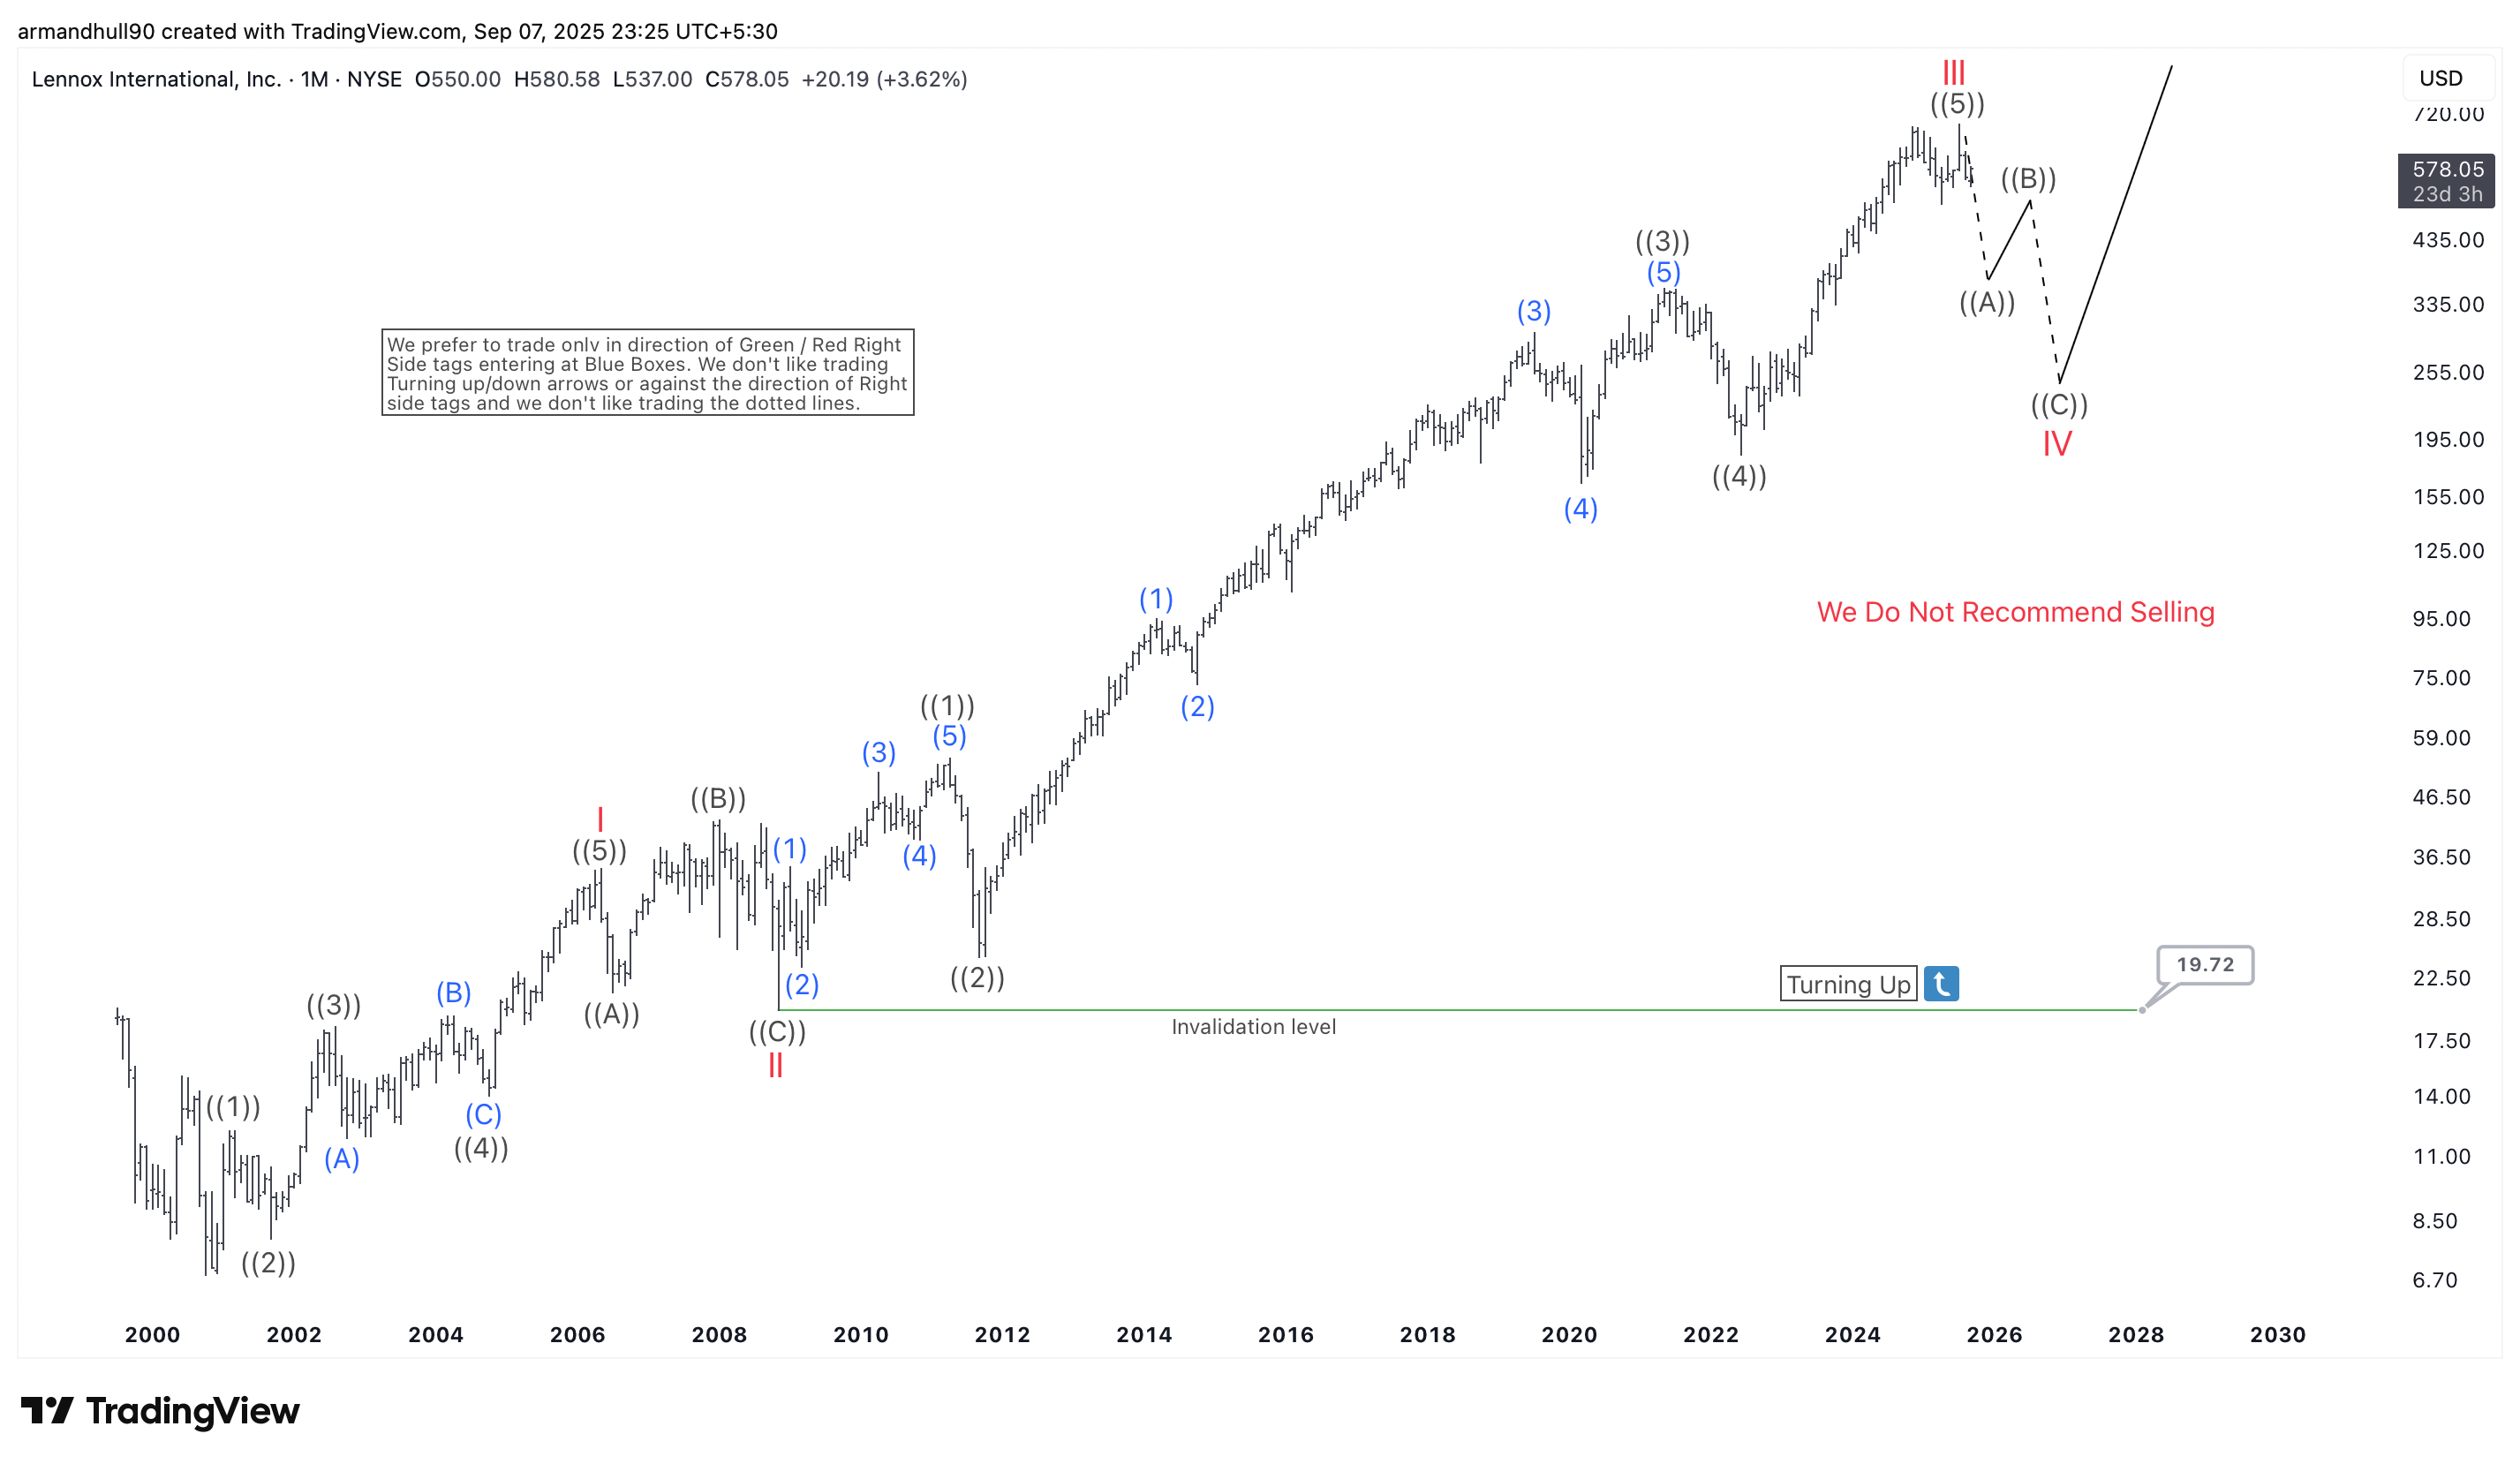
Lennox International (LII) Elliott Wave Analysis – Correction Ahead Before the Next Rally
Read MoreLII stock enters a wave IV corrective phase, offering potential buying opportunities before a strong bullish wave V rally resumes. Lennox International (LII) has been in a strong uptrend for many years, following a clear Elliott Wave impulsive structure. The stock recently completed wave III on the monthly chart and is now entering a corrective […]
-
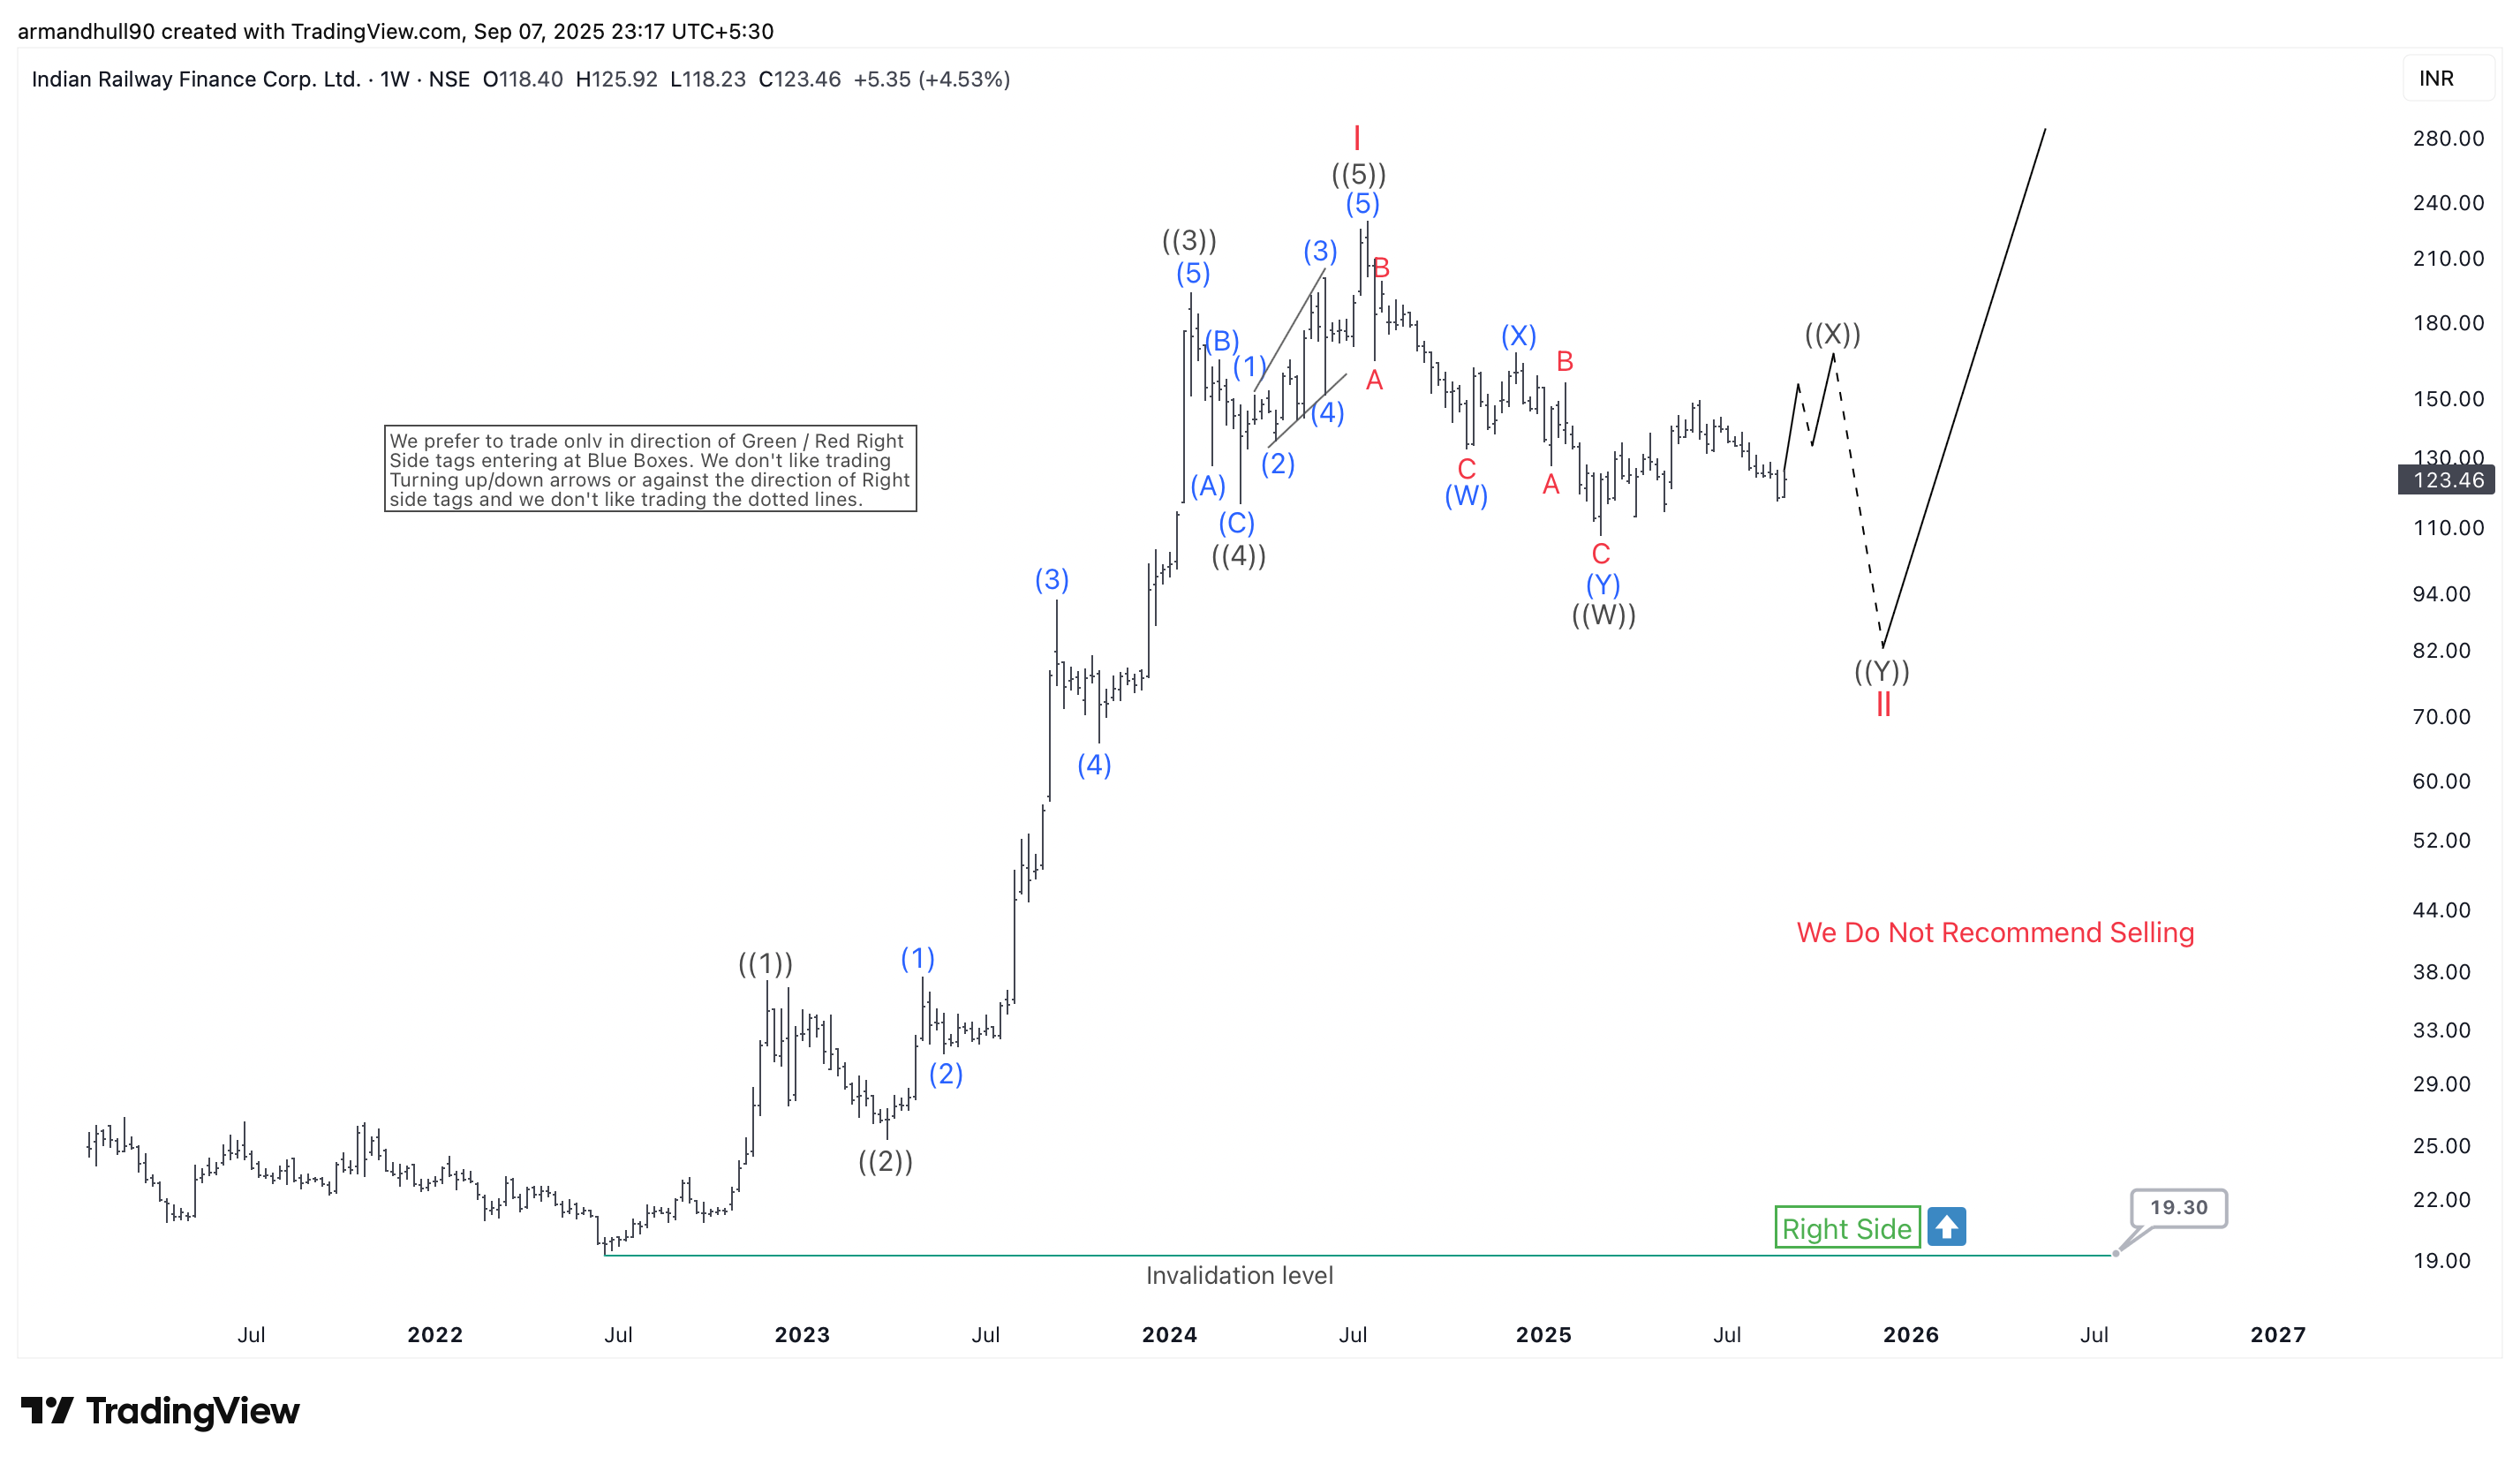
IRFC Elliott Wave Analysis: Wave II Correction Nearing Completion Before Major Bullish Rally
Read MoreIndian Railway Finance Corporation Ltd. (IRFC) is correcting within a double three Elliott Wave pattern in wave II after completing a strong five-wave rally in wave I. Indian Railway Finance Corporation Ltd. (IRFC) has maintained a strong bullish trend over the past months. After forming a significant low, the stock started a powerful rally, completing […]
-
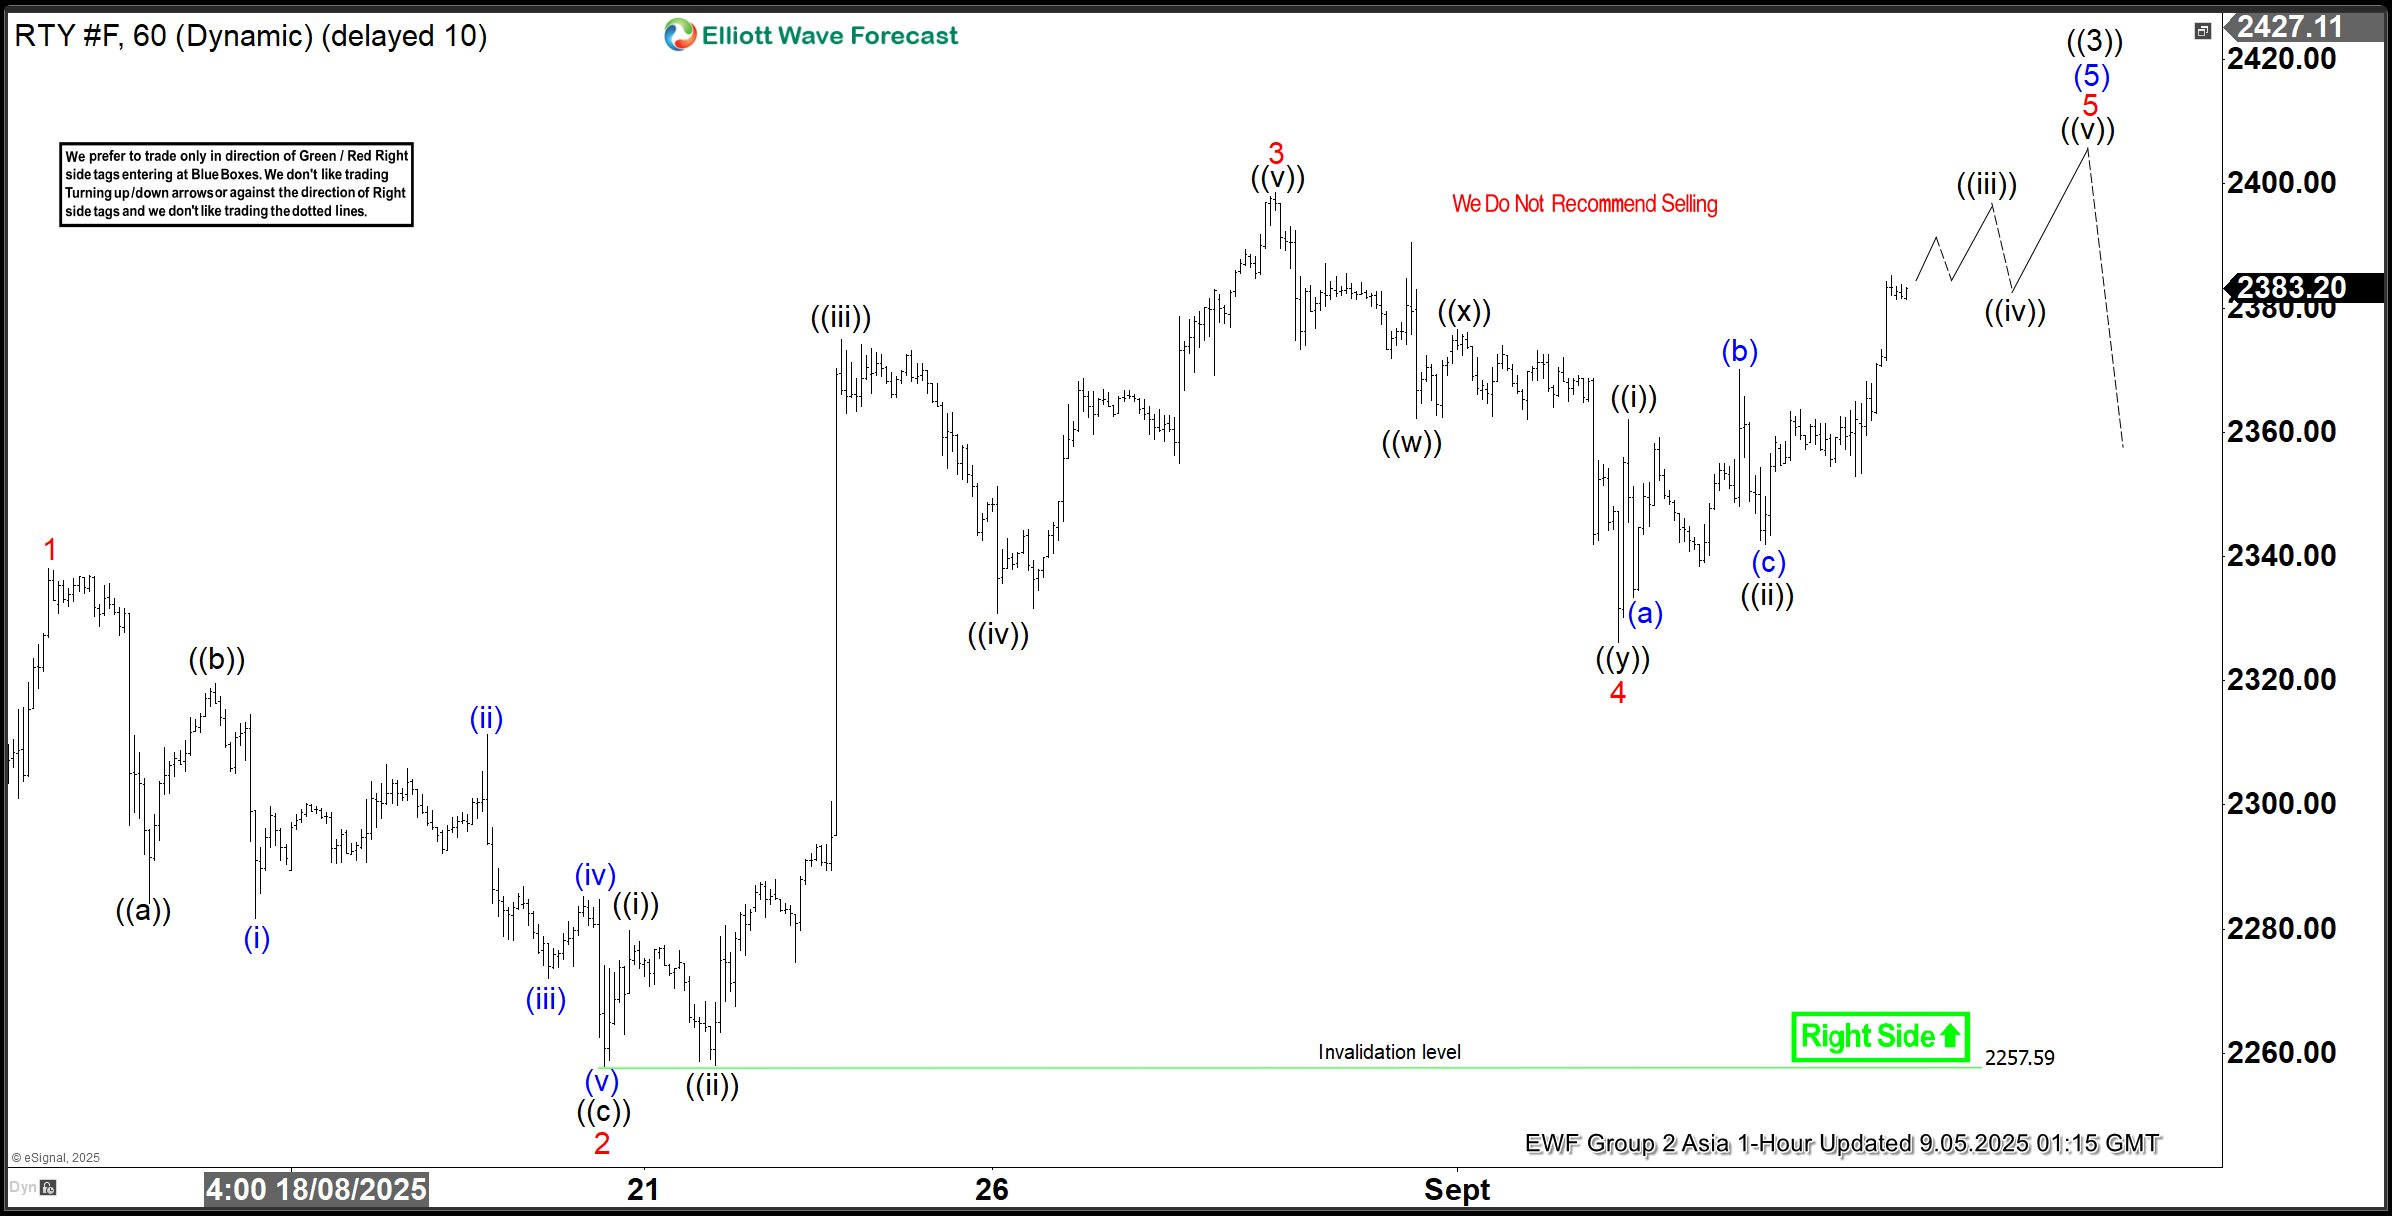
E-mini Russell 2000 Index Futures (RTY) Targets Wave 5 Diagonal
Read MoreE-Mini Russell Index Futures (RTY) is looking to rally to complete wave 5 diagonal. This article and video look at the Elliott Wave path and target.
-
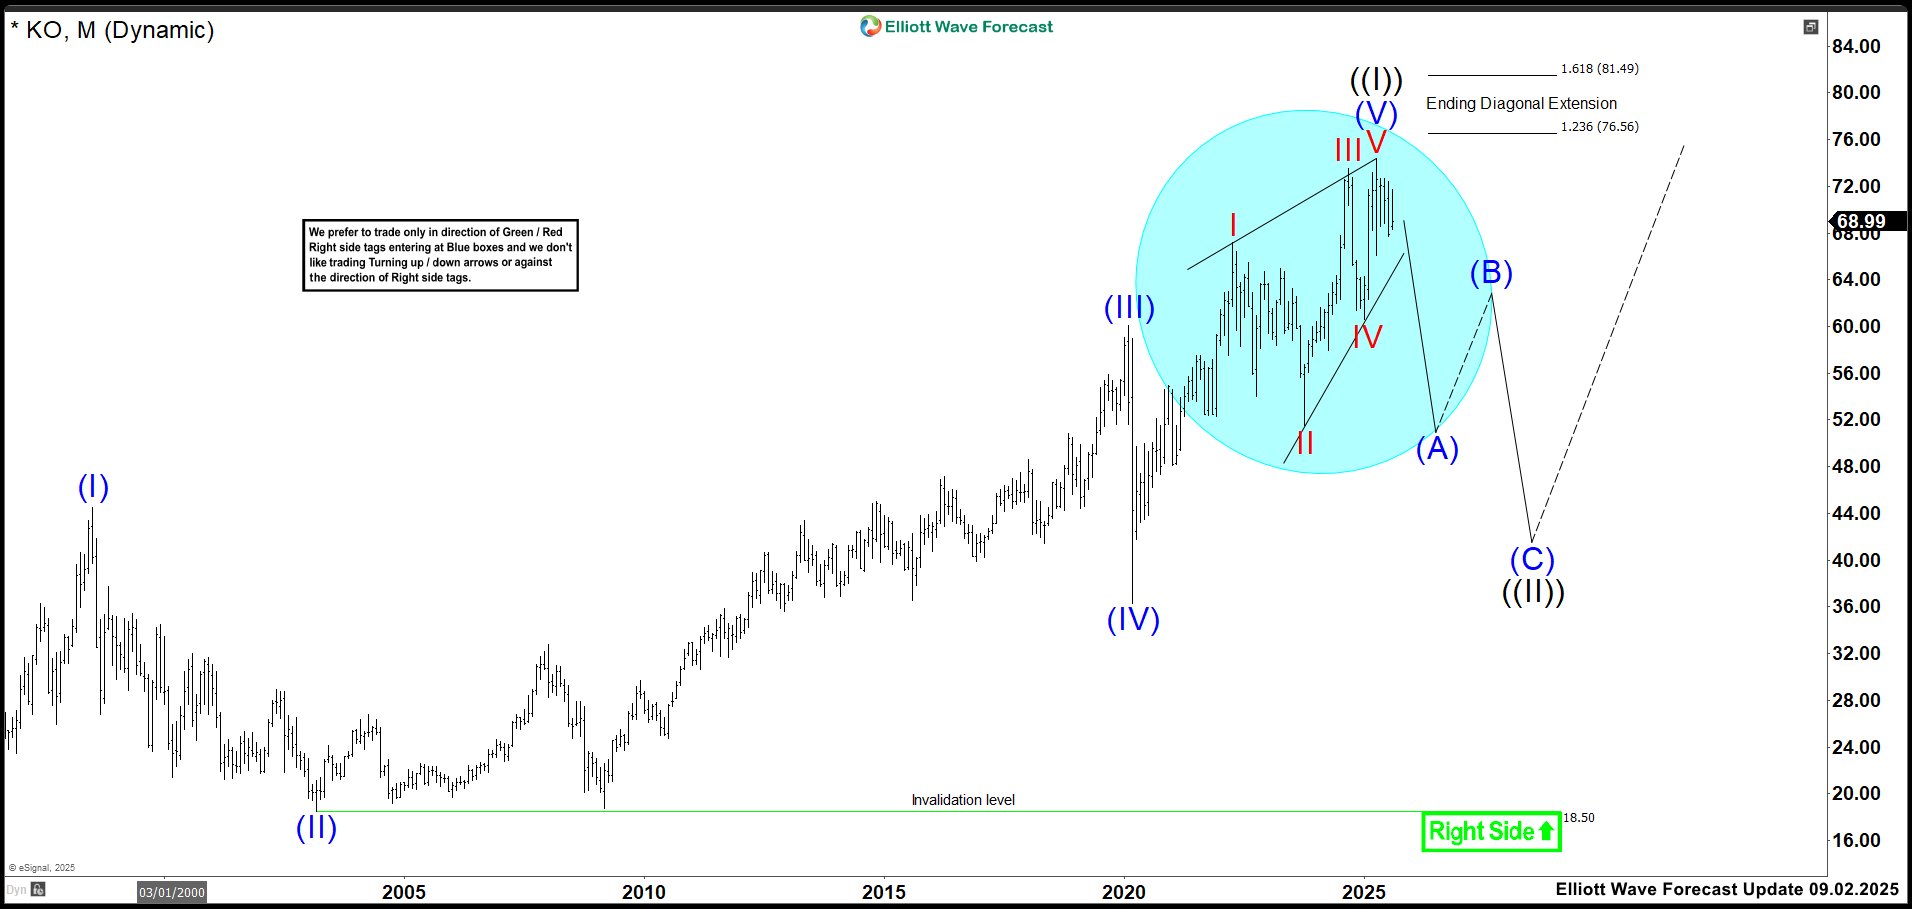
KO Alert: Is an Ending Diagonal About to Disrupt the Rally?
Read MoreCoca-Cola (KO) shows resilience in a shifting market. In Q2 2025, it posted 5% organic revenue growth and 58% EPS jump. Despite currency headwinds, KO improved operating margin to 34.1%, driven by pricing power, cost control, and strategic campaigns like “Share a Coke.” Although unit case volume dipped slightly due to weather and consumer pressure, […]
-
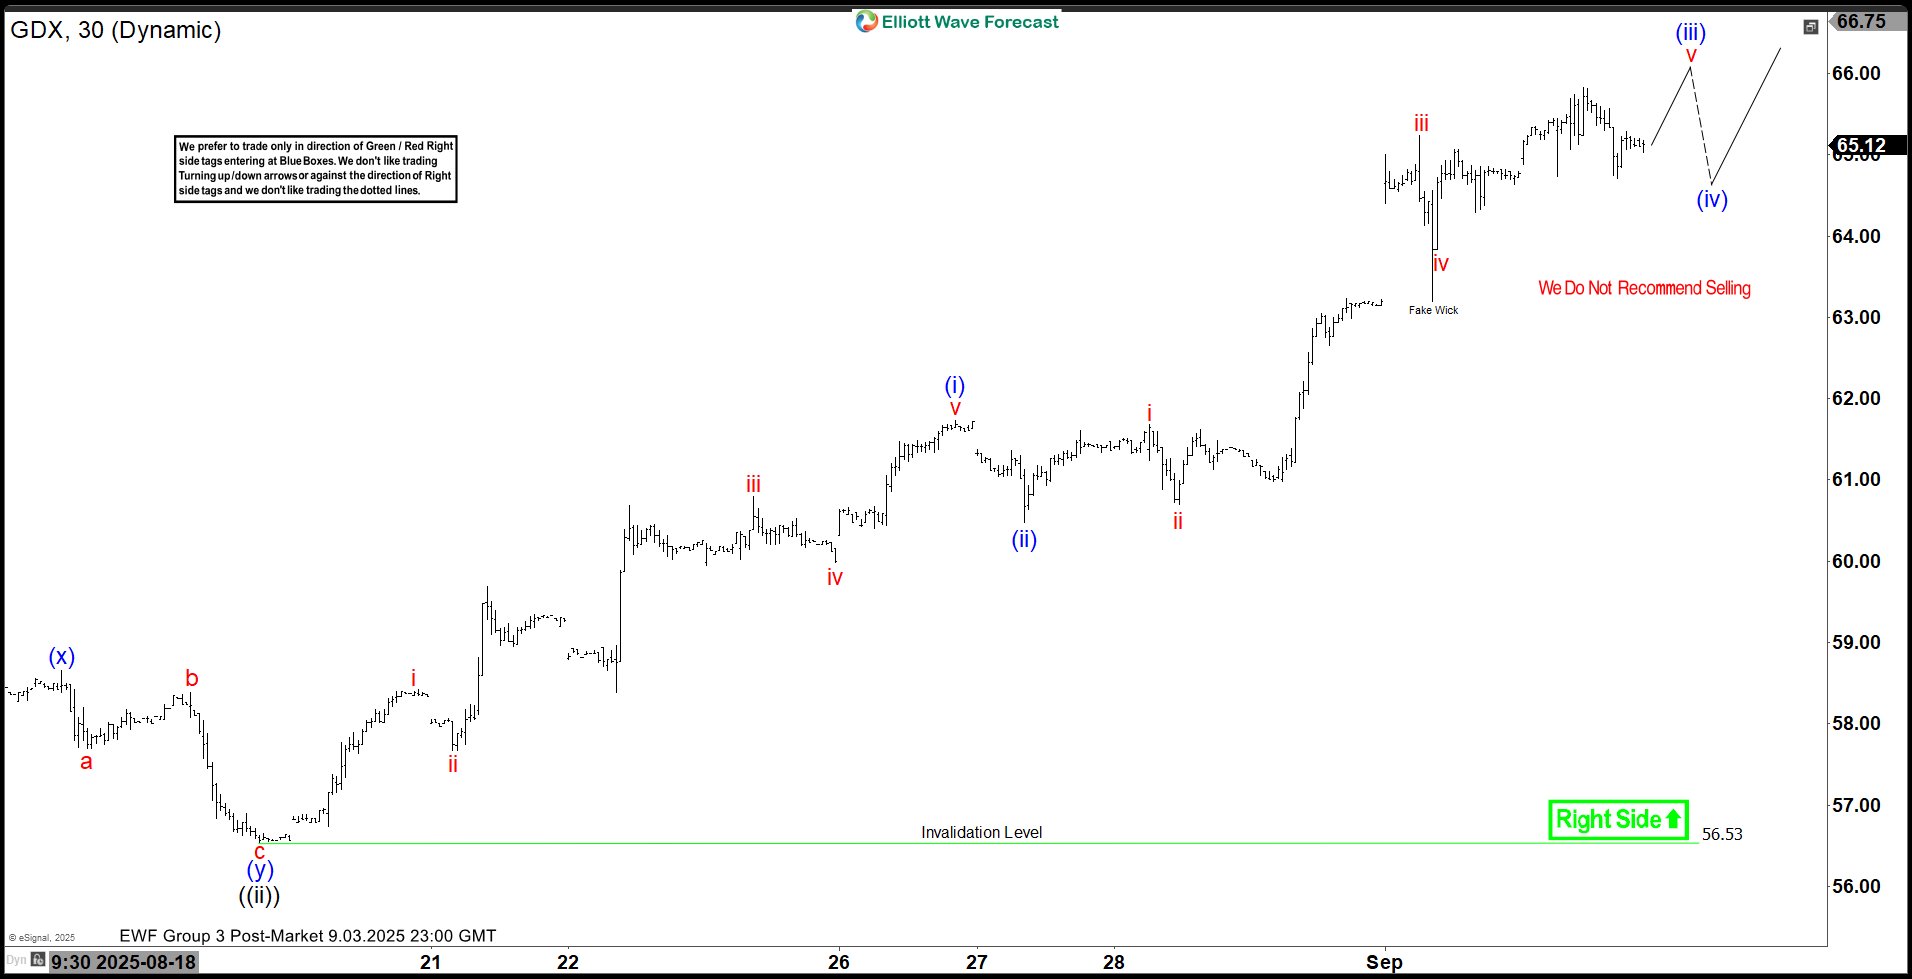
GDX Elliott Wave Update: Rally Gains Momentum in Wave ((iii))
Read MoreGold Miners ETF (GDX) is rallying in powerful wave ((iii)). This article and video look at the Elliottwave path of the Index.
-
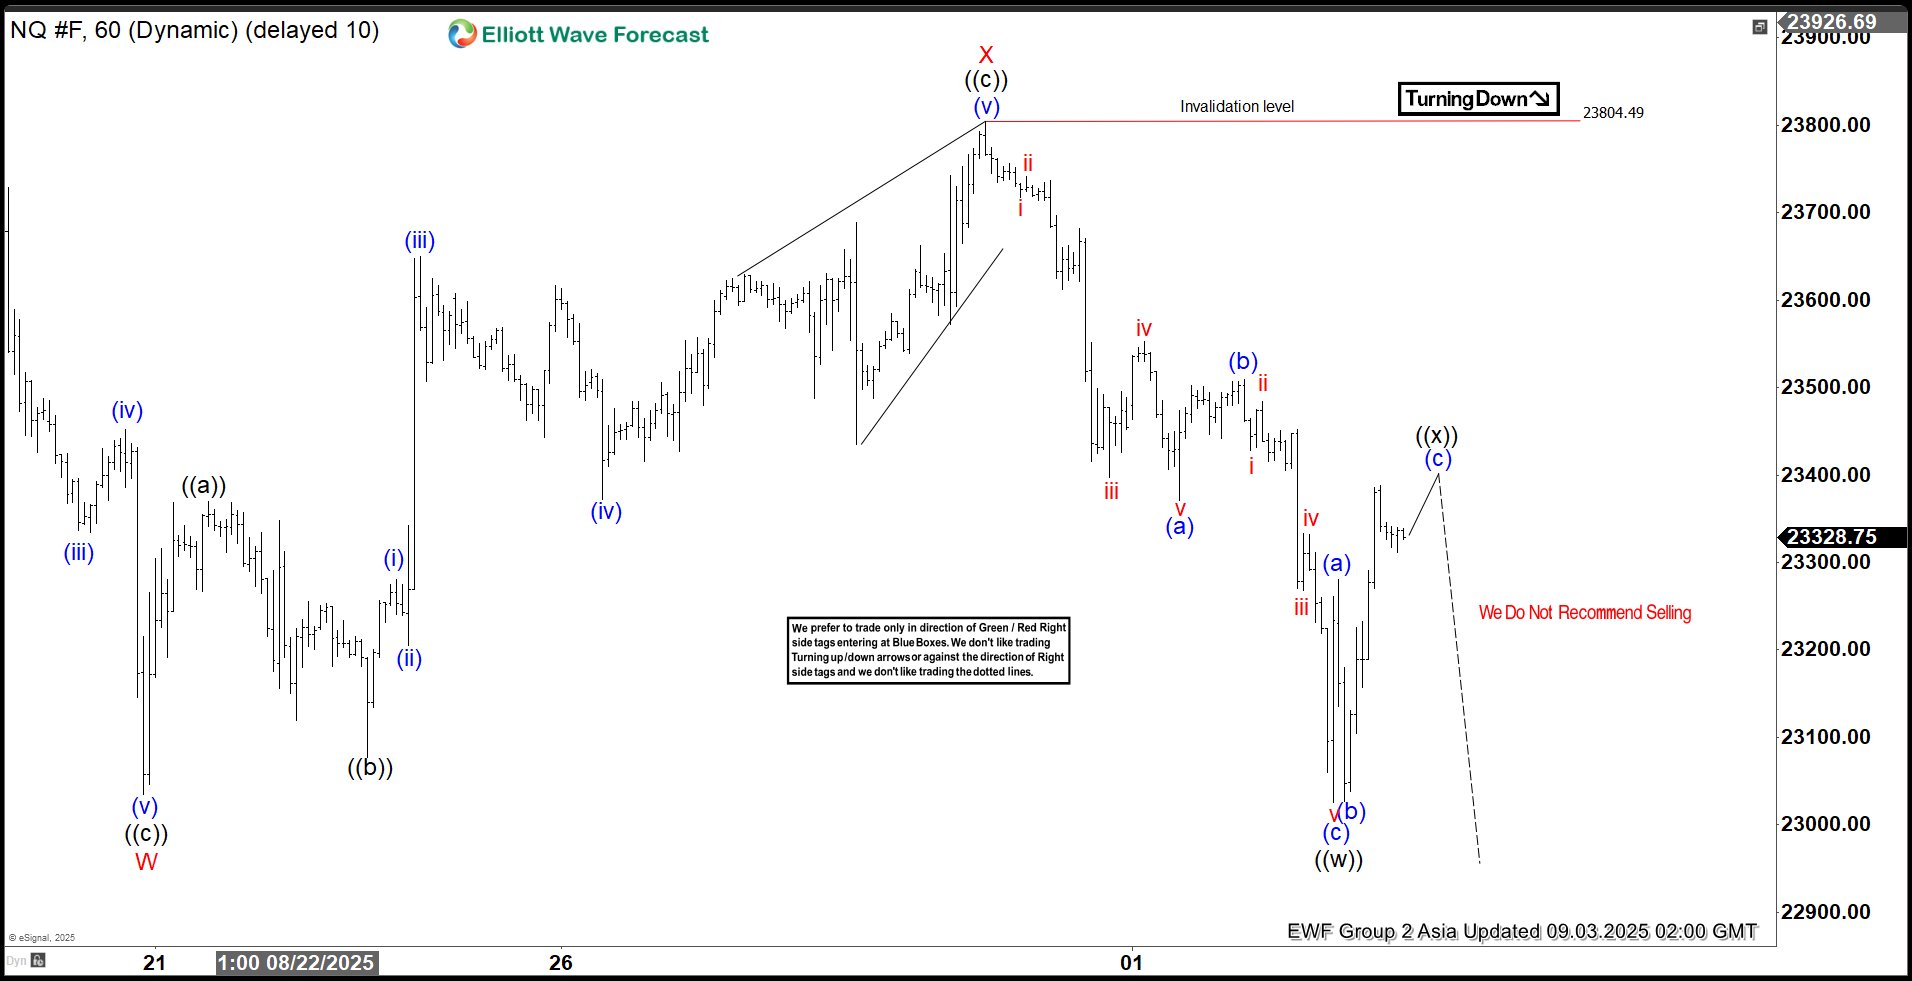
Elliott Wave Analysis Nasdaq Futures (NQ) Double Correction Targets 22752 Downside
Read MoreNasdaq Futures (NQ) shows a bearish sequence from 13 August high favoring more downside. This article and video look at the Elliott Wave path and target.