

The Power of 3-7-11 and the Grand Super Cycle: How We Saw the Bullish Turn in April 2025 Back on April 9, 2025, while World Indices were dropping sharply and global sentiment had turned overwhelmingly bearish, we published an article that challenged the fear-driven narrative. We explained why selling was not the right approach and […]
-
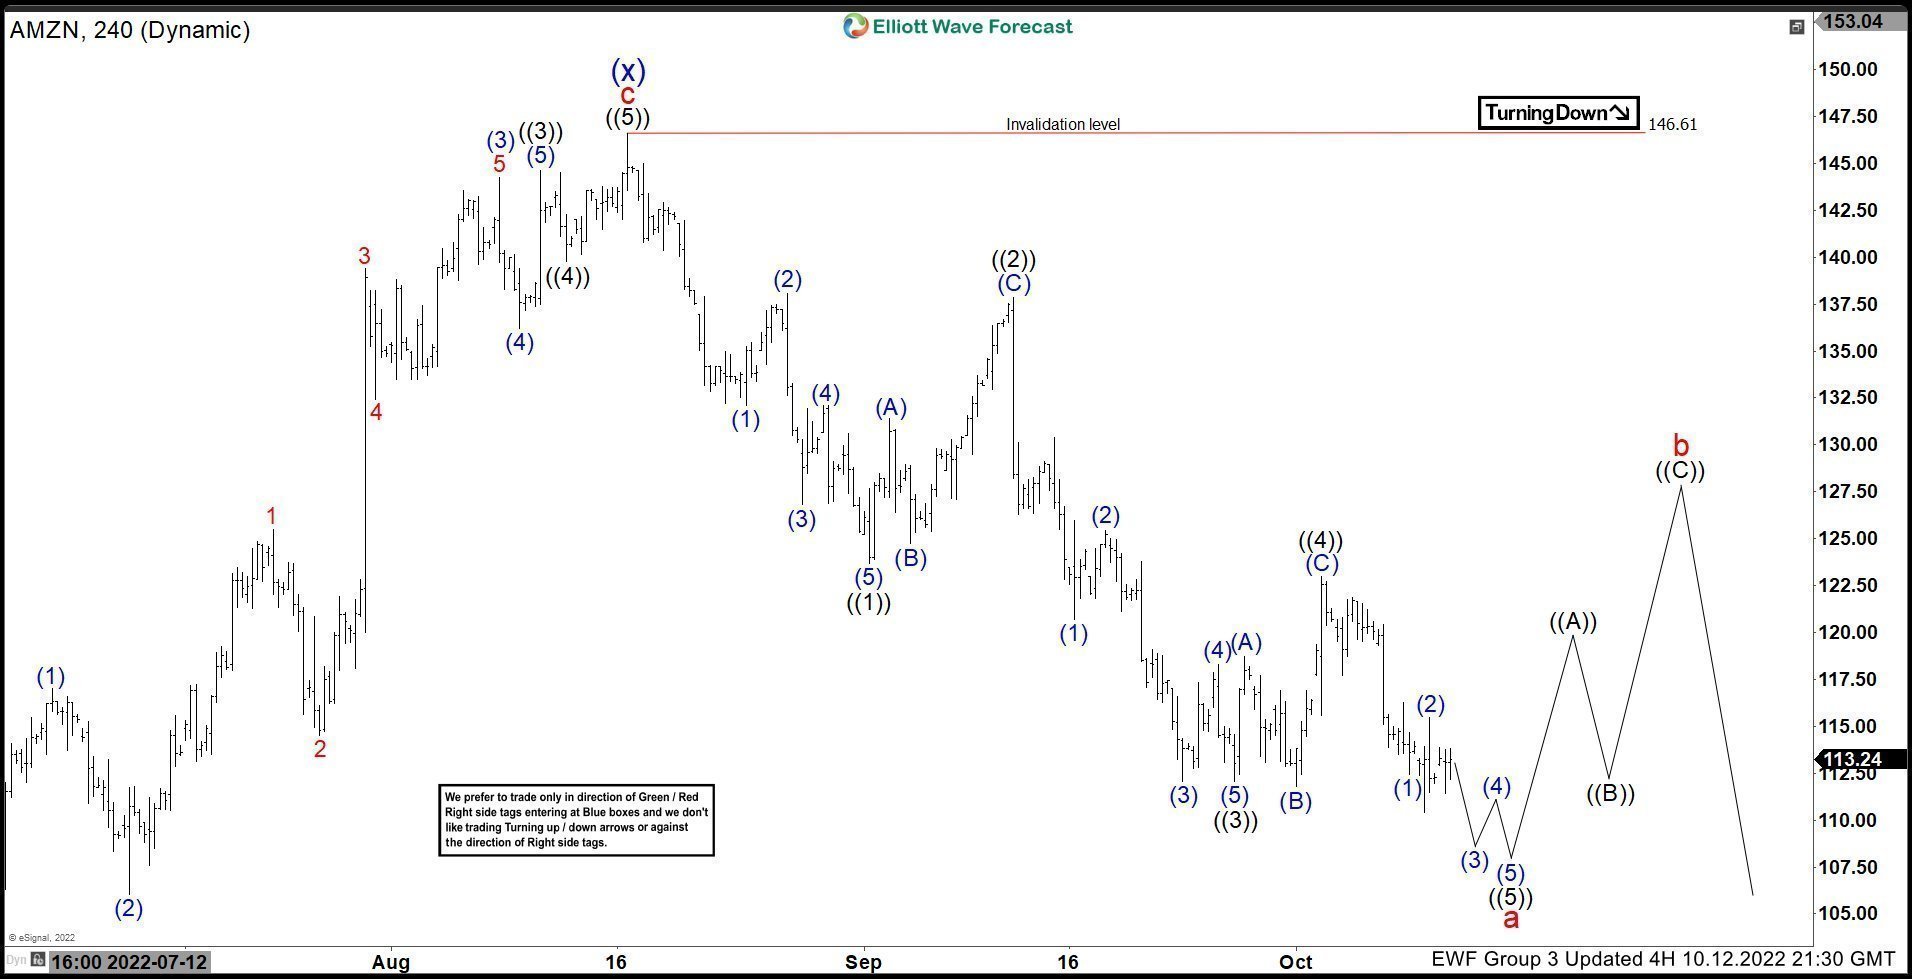
Amazon $AMZN Elliott Wave: Calling For A Further Decline
Read MoreHello fellow traders. As our members know, Amazon stock has completed 5 waves structure in the cycle from the 146.61. We were calling for a 3 waves bounce against the mentioned high after which we expected the price in stock to drop toward new lows. In previous blog on Amazon we shown how we called […]
-
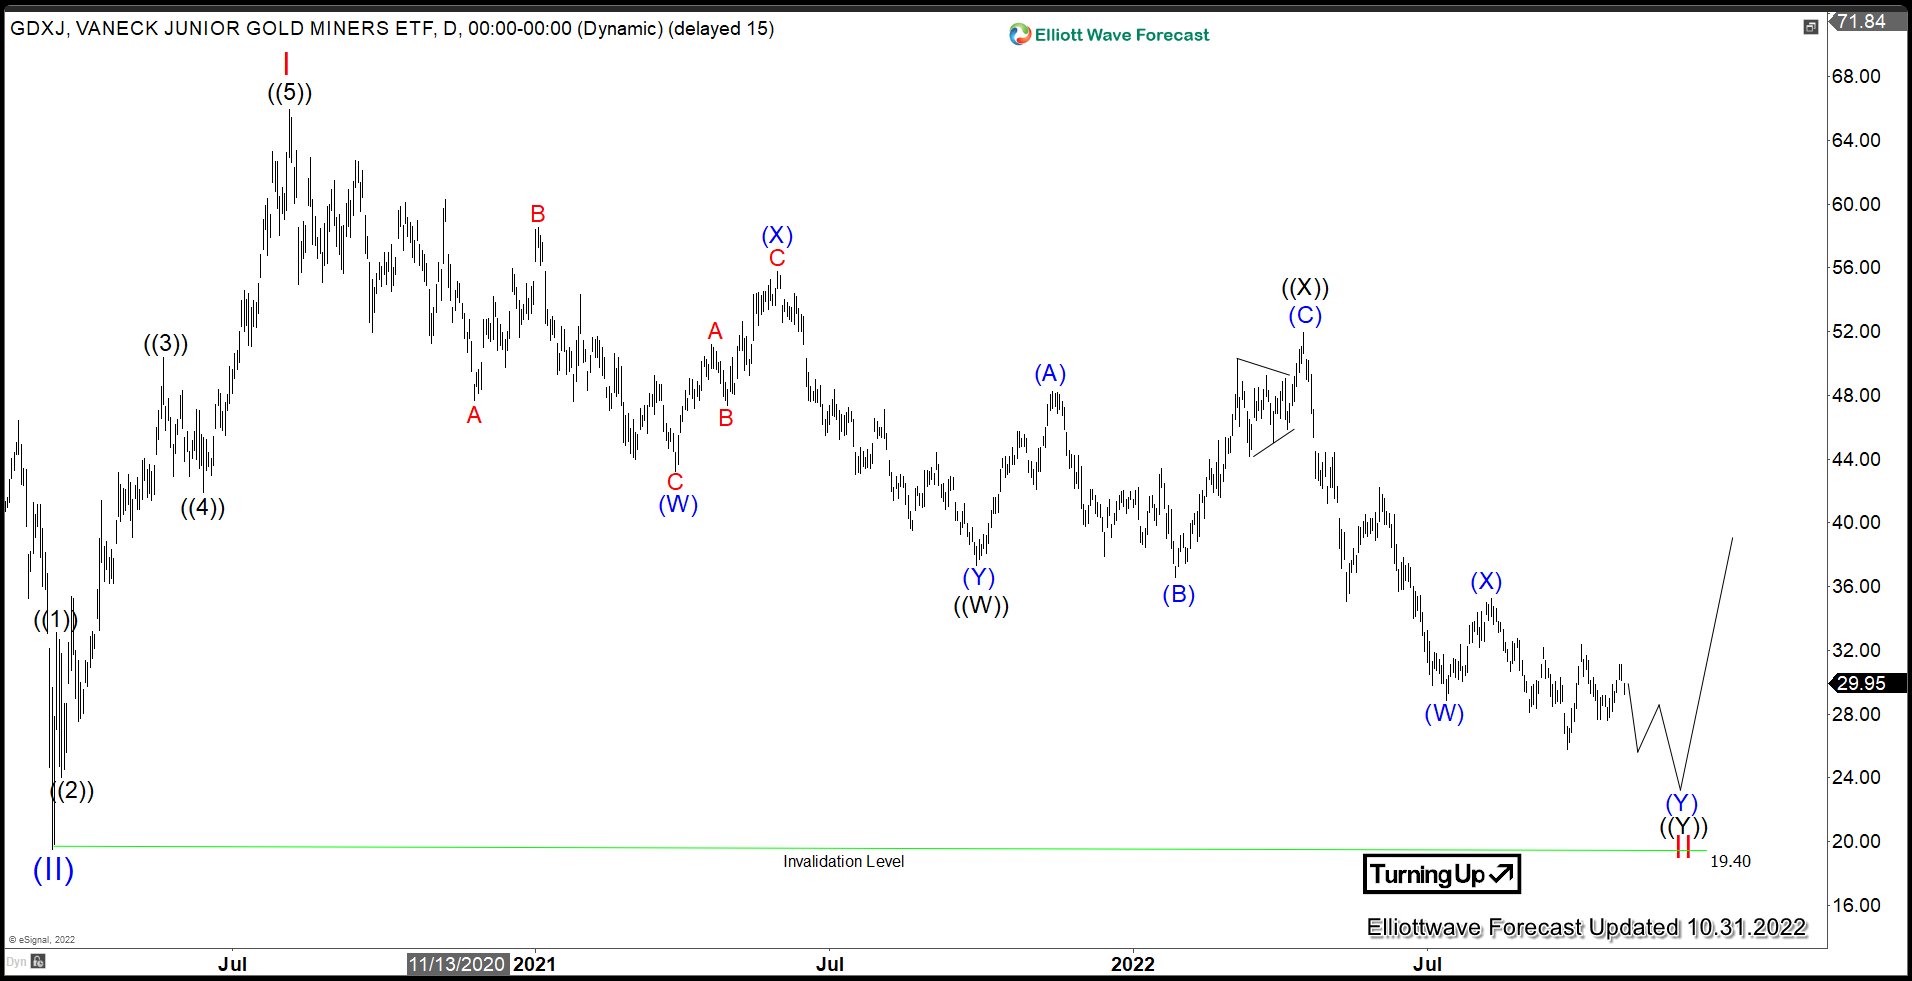
GDXJ Looking to Form Bottom
Read MoreGold and related miners continue to suffer a setback as the Fed continues its aggressive rate hike to combat inflation. However, there’s recent indication that the world’s central banks may reduce the pace of the hike due to the rising probability of a recession. In this update, we will look at the technical outlook in […]
-

Caterpillar Inc. ($CAT) bounce is a Bull Trap. More Downside should take place soon.
Read MoreGood day Traders and Investors. In today’s article, we will look at the past performance of Caterpillar Inc. ($CAT). In our last article we explained that the stock has reached the Blue Box area where a bounce can happen. This is how we saw it back in Sep 2022. Caterpillar ($CAT) ElliottWave October 2022 View (Weekly): Since […]
-
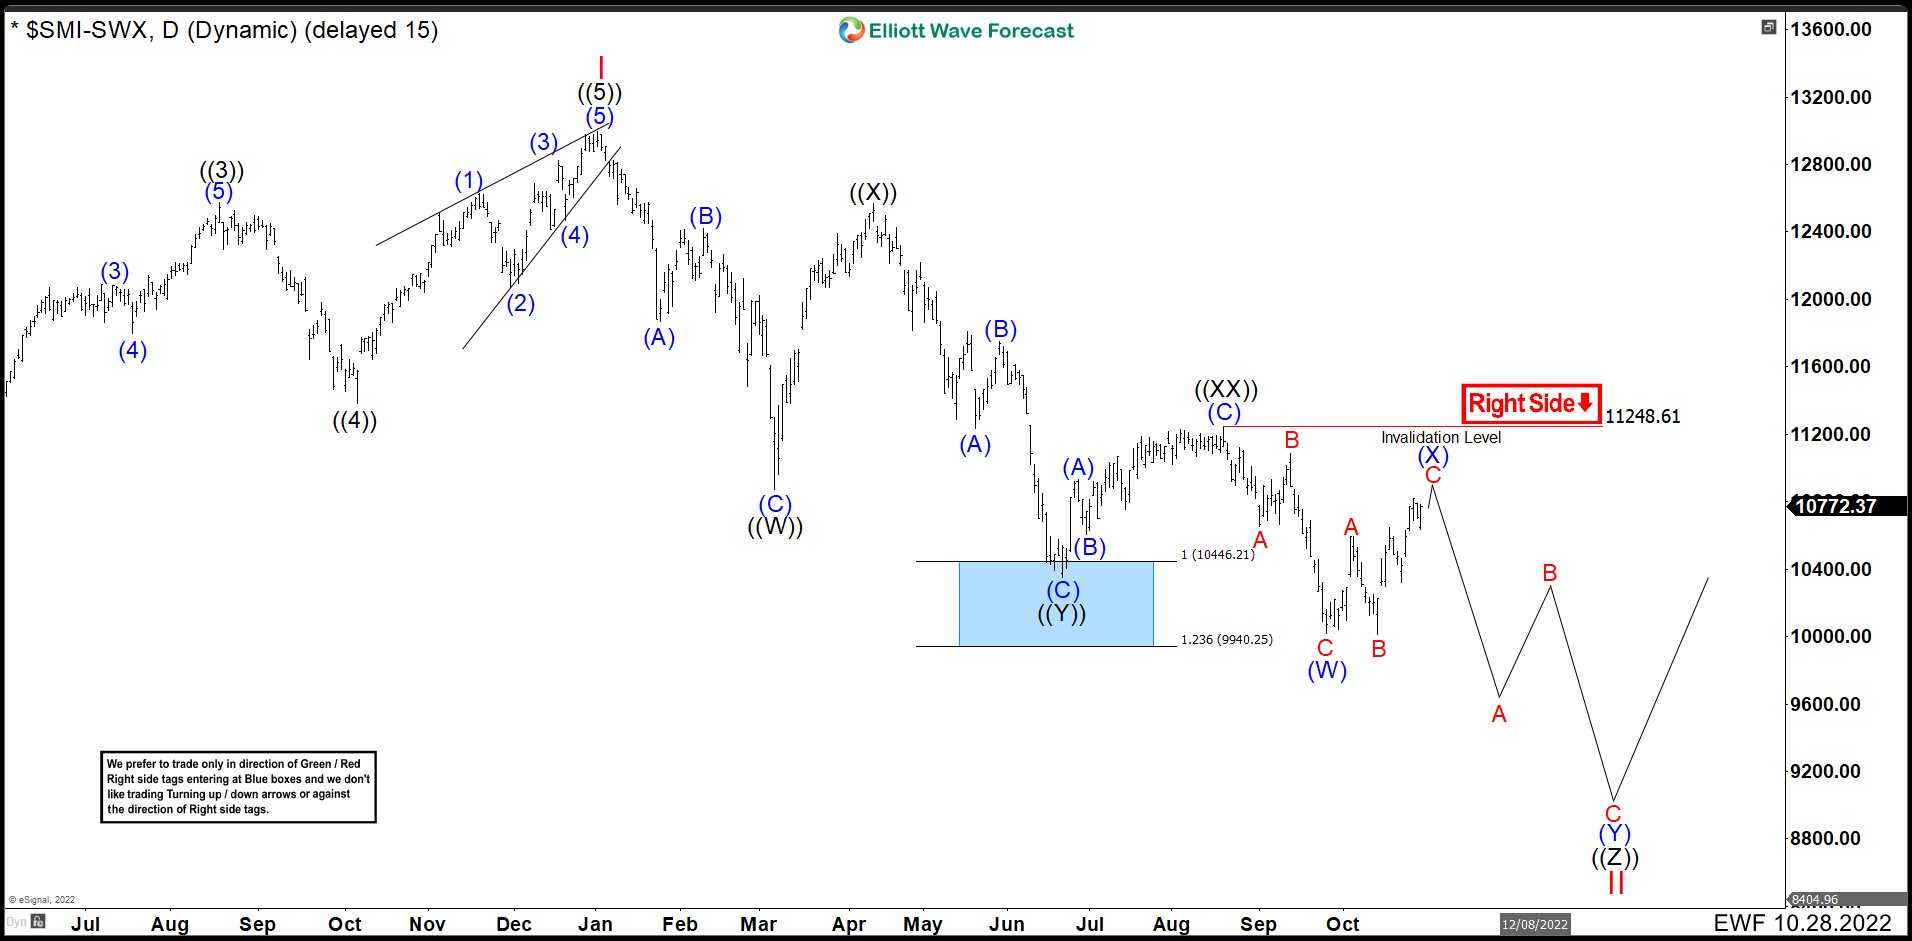
SMI (Swiss Index) Entered In A Triple Correction Structure
Read MoreThe Swiss Market Index (SMI) is Switzerland’s blue-chip stock market index, which makes it the most followed in the country. It is made up of 20 of the largest and most liquid Swiss Performance Index (SPI) stocks. The SMI is not adjusted for dividends. SMI December 04th Daily Chart This is last year’s chart, where […]
-
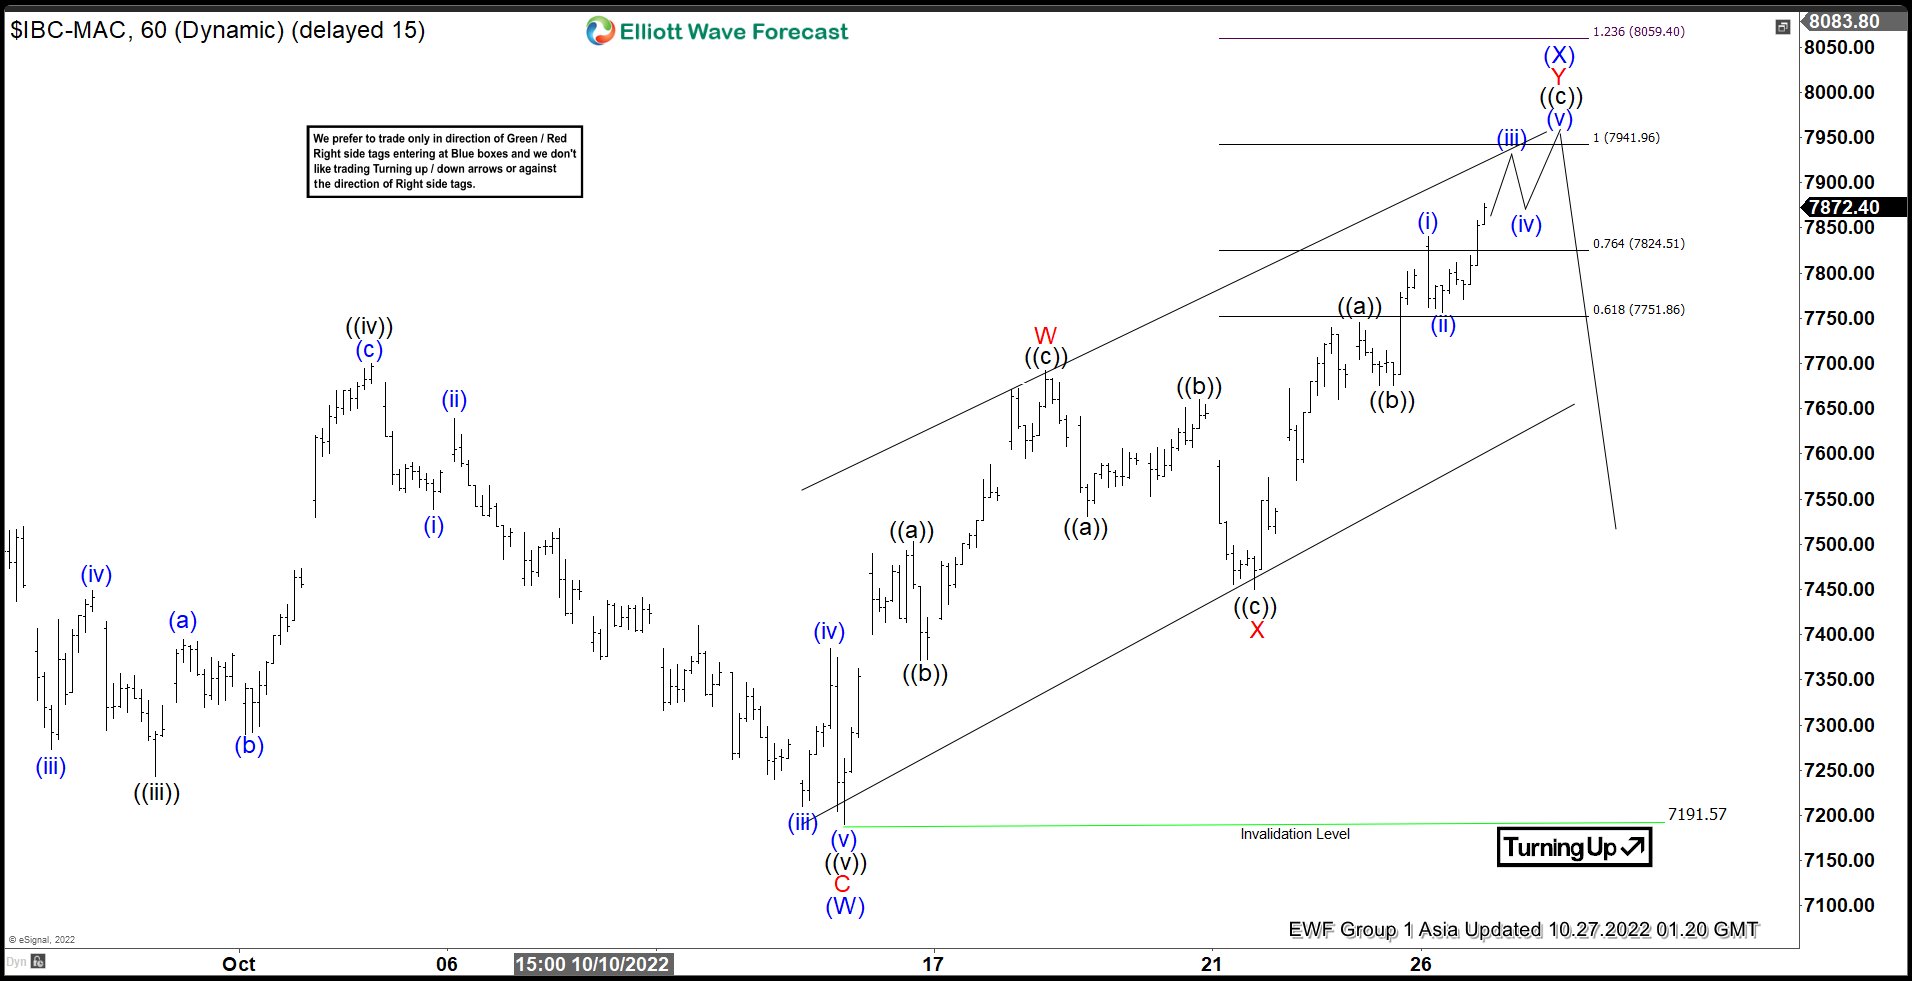
Elliott Wave View: IBEX Soon Reaching Resistance Area
Read MoreIBEX is correcting cycle from 5.30.2022 high in 3, 7, 11 swing before turning lower. This article and video look at the Elliott Wave path.
-
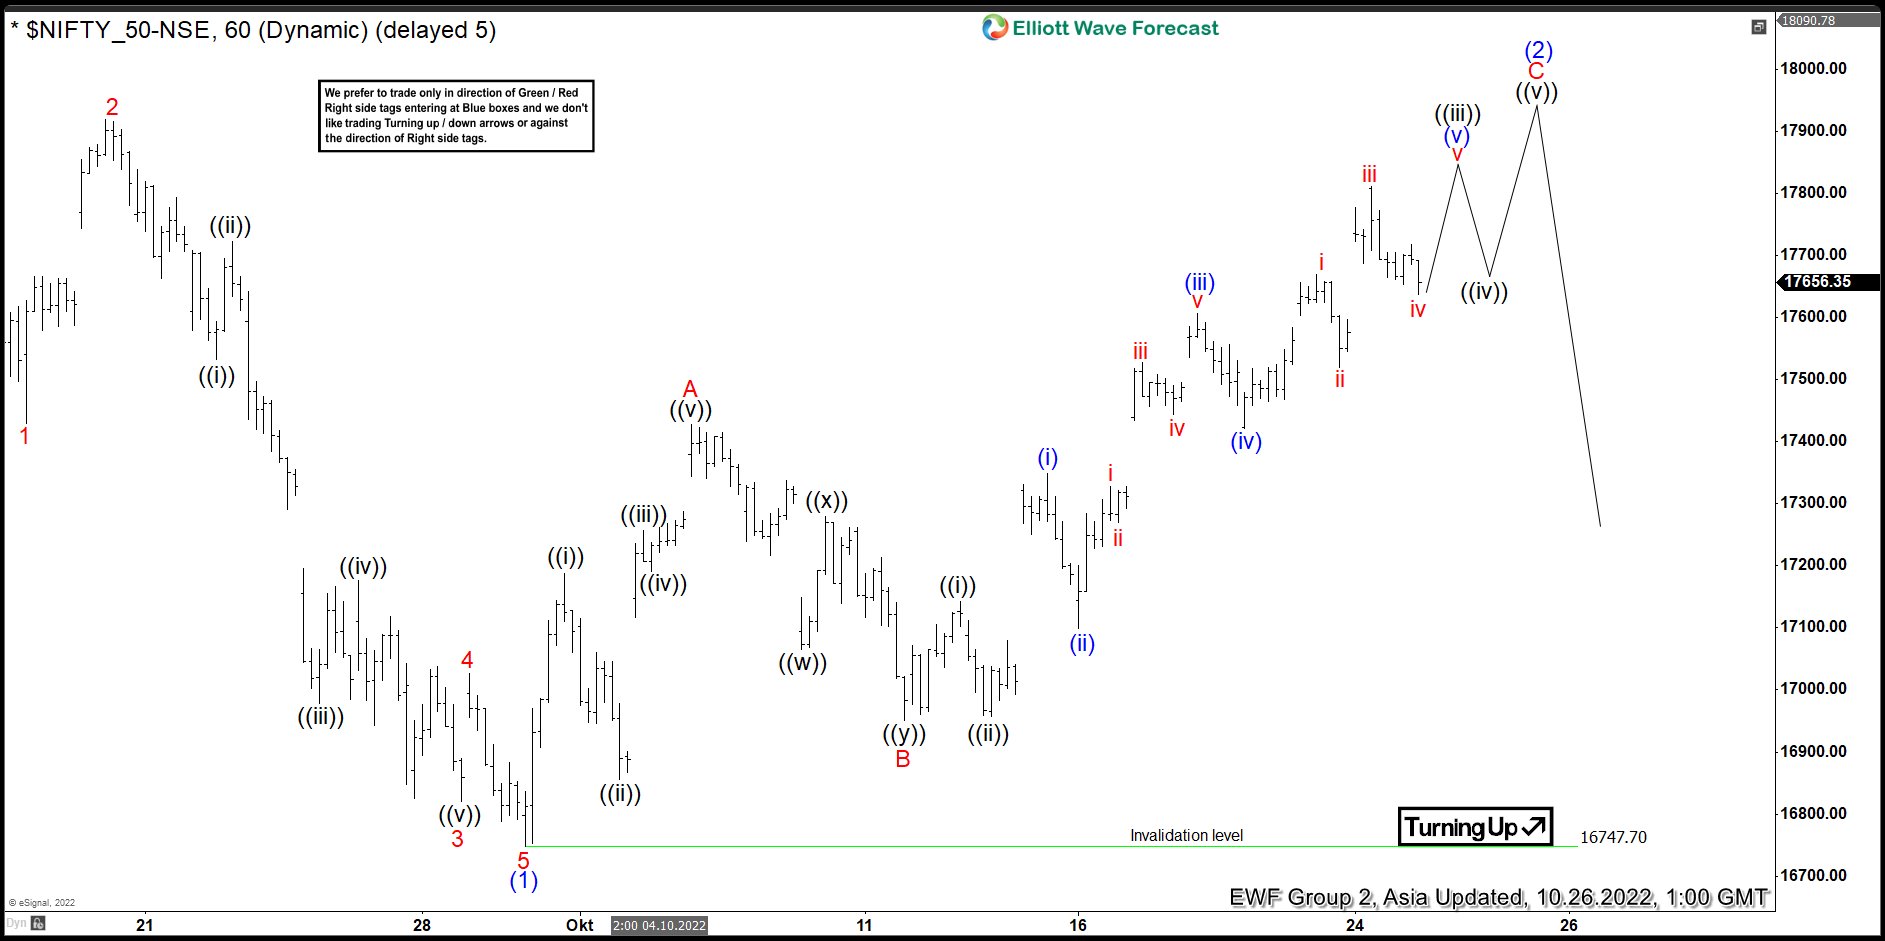
Elliott Wave View: Nifty can see sellers soon
Read MoreNifty has reached the extreme area from 9.30.2022 low and soon can see 3 waves pullback at least. This article and video look at the Elliott Wave chart