

The Power of 3-7-11 and the Grand Super Cycle: How We Saw the Bullish Turn in April 2025 Back on April 9, 2025, while World Indices were dropping sharply and global sentiment had turned overwhelmingly bearish, we published an article that challenged the fear-driven narrative. We explained why selling was not the right approach and […]
-
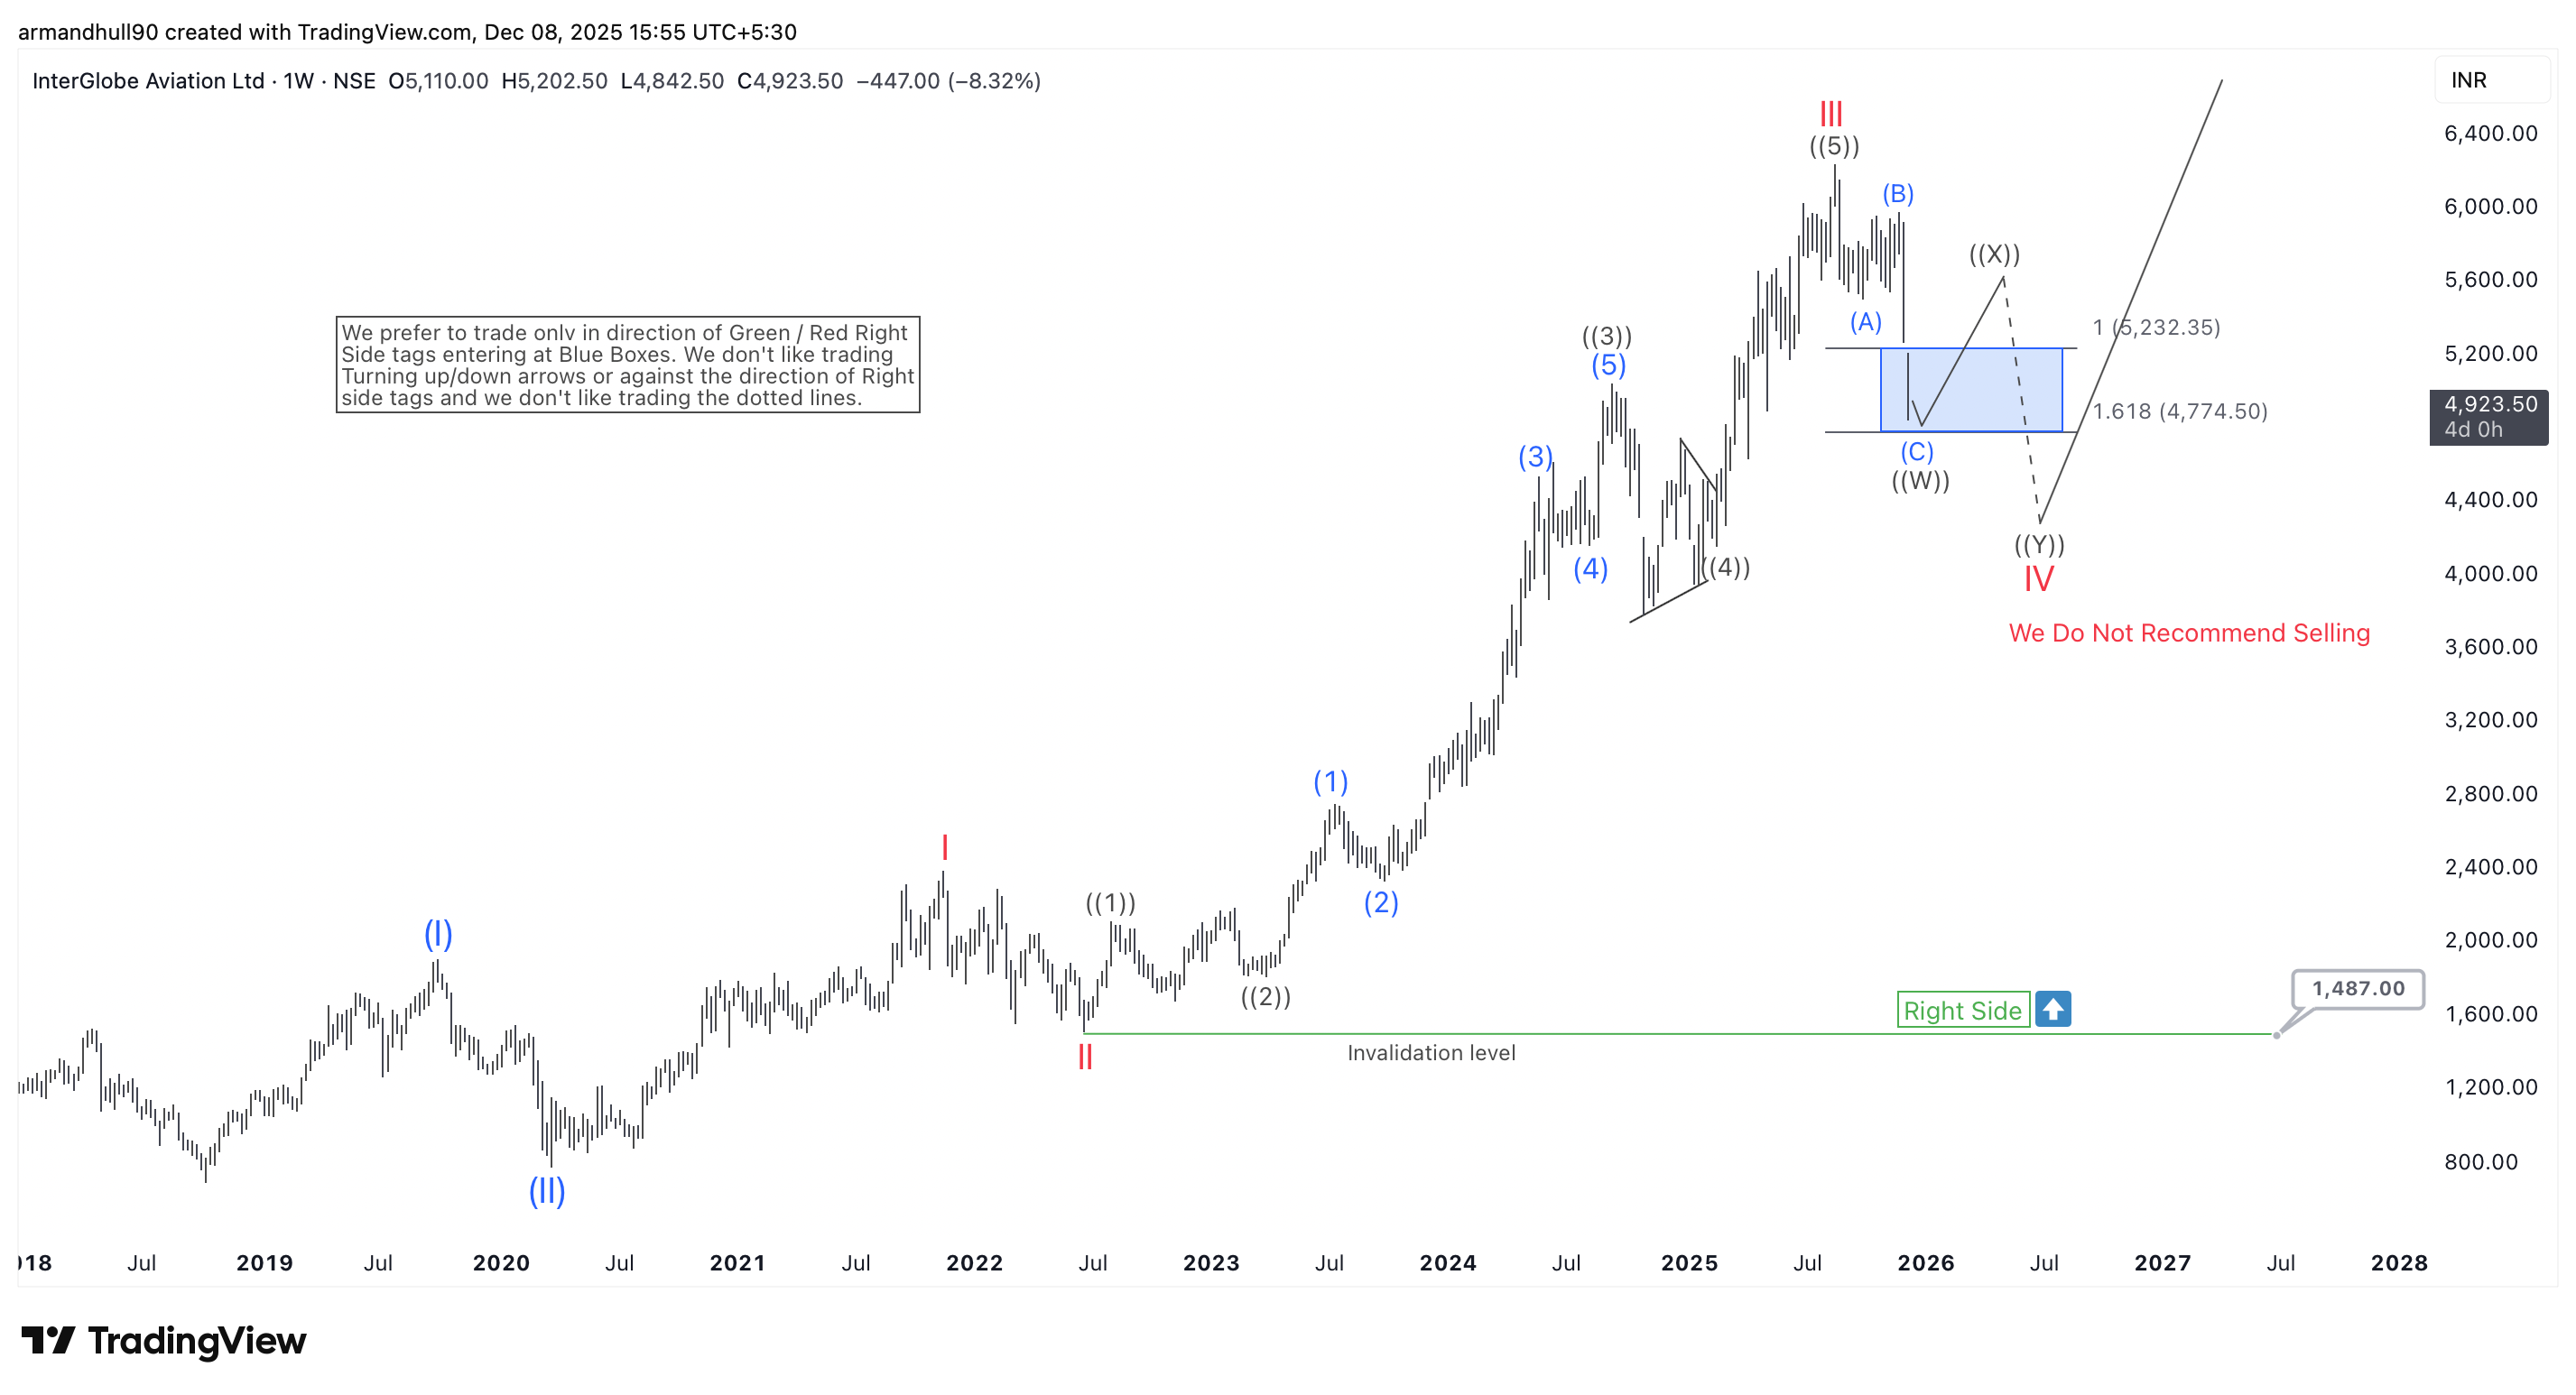
Has IndiGo Finished Its Pullback? Wave V Rally Next?
Read MoreA detailed weekly Elliott Wave analysis of IndiGo highlighting the Wave IV blue-box zone, right-side bullish outlook, and long-term upside potential. InterGlobe Aviation Ltd (NSE: INDIGO) remains in a strong long-term uptrend. The weekly chart shows a clean Elliott Wave structure that supports this view. The stock recently completed a higher-degree Wave III near the […]
-
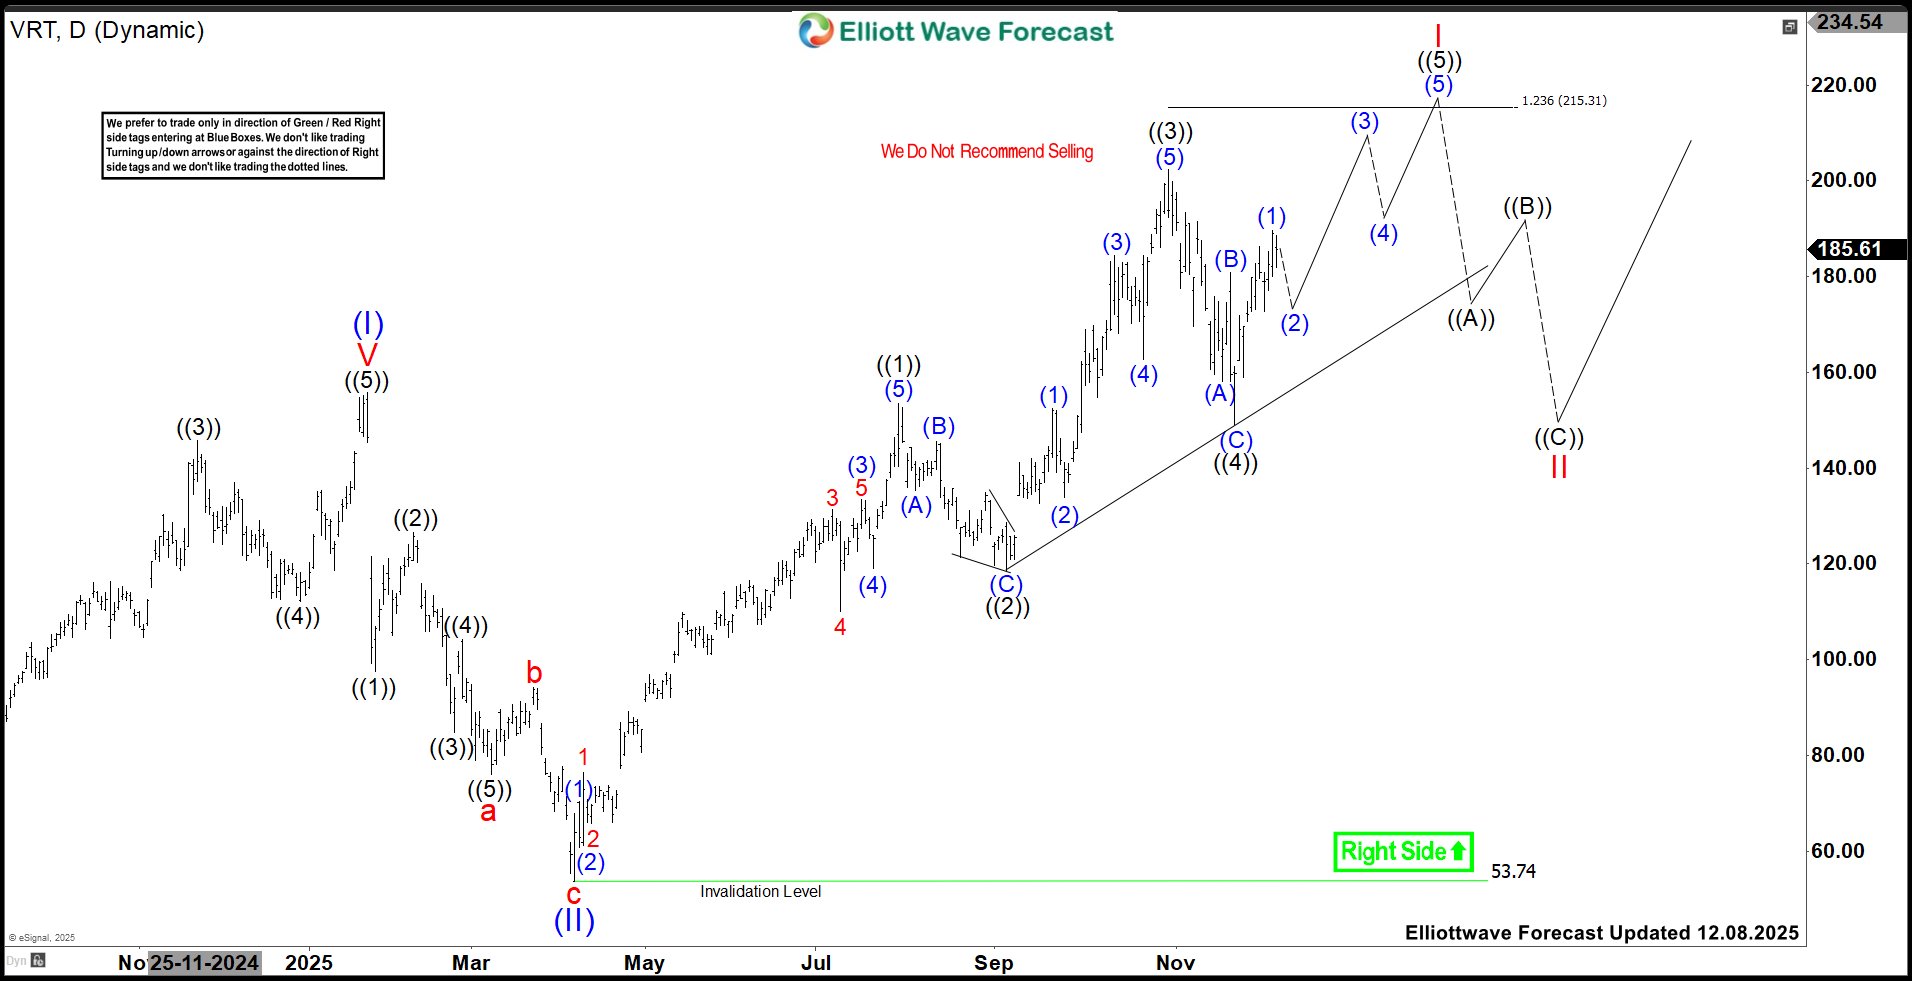
Vertiv Holdings (VRT) Eyes New High Between $215.3 – $232.75
Read MoreVertiv Holdings Co., (VRT) is an American multinational provider of critical infrastructure & services for data centers, communication networks & commercial & industrial environments. It comes under Industrials sector & trades as “VRT” ticket for NYSE. VRT favors bullish sequence in weekly & expects push higher against 11.21.2025 low. It favors rally between $215.3 – […]
-
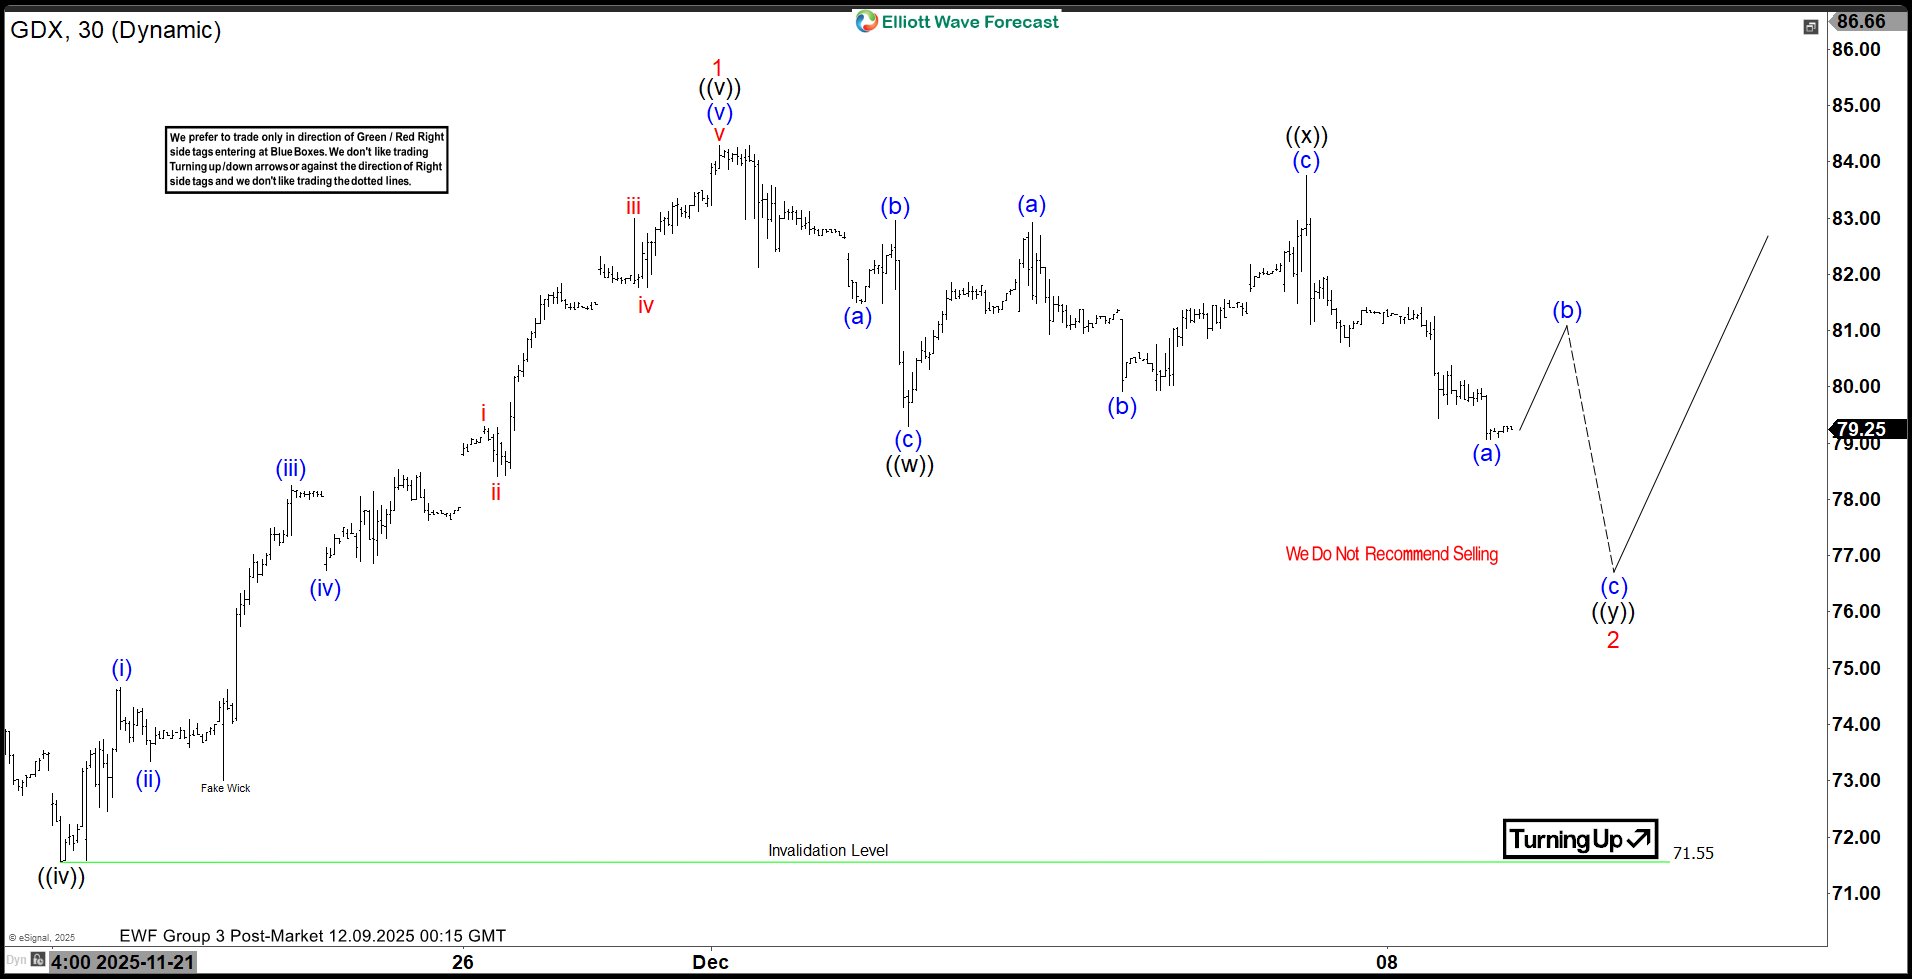
GDX Anticipates a Double Correction Within Sustained Bullish Trend
Read MoreGold Miners ETF (GDX) is looking to correct cycle from Oct 28 low as a double three. This article and video look at the Elliott Wave path.
-

BlackRock (BLK) Next Buying Opportunity Below $1,000
Read MoreWe previously mapped BlackRock’s (NYSE: BLK) bullish weekly path earlier this year. Today, our analysis continues with the Elliott Wave structure behind its rally from the 2022 low. This update highlights the next high-probability buying opportunity emerging for the stock. Elliott Wave Analysis BlackRock‘s April 2025 correction marked wave ((4)), finding support in the Blue Box […]
-

McDonald’s (MCD) is lagging, will it burn out or bounce back?
Read MoreMcDonald’s (MCD) stock has faced short-term pressure, dropping about 2% recently, yet its fundamentals remain strong. The company continues to benefit from its global franchising model, which delivers high margins and stable cash flow. Moreover, analysts highlight that despite inflationary challenges, McDonald’s has maintained revenue growth and resilient consumer demand. Transitioning into the next quarter, […]
-
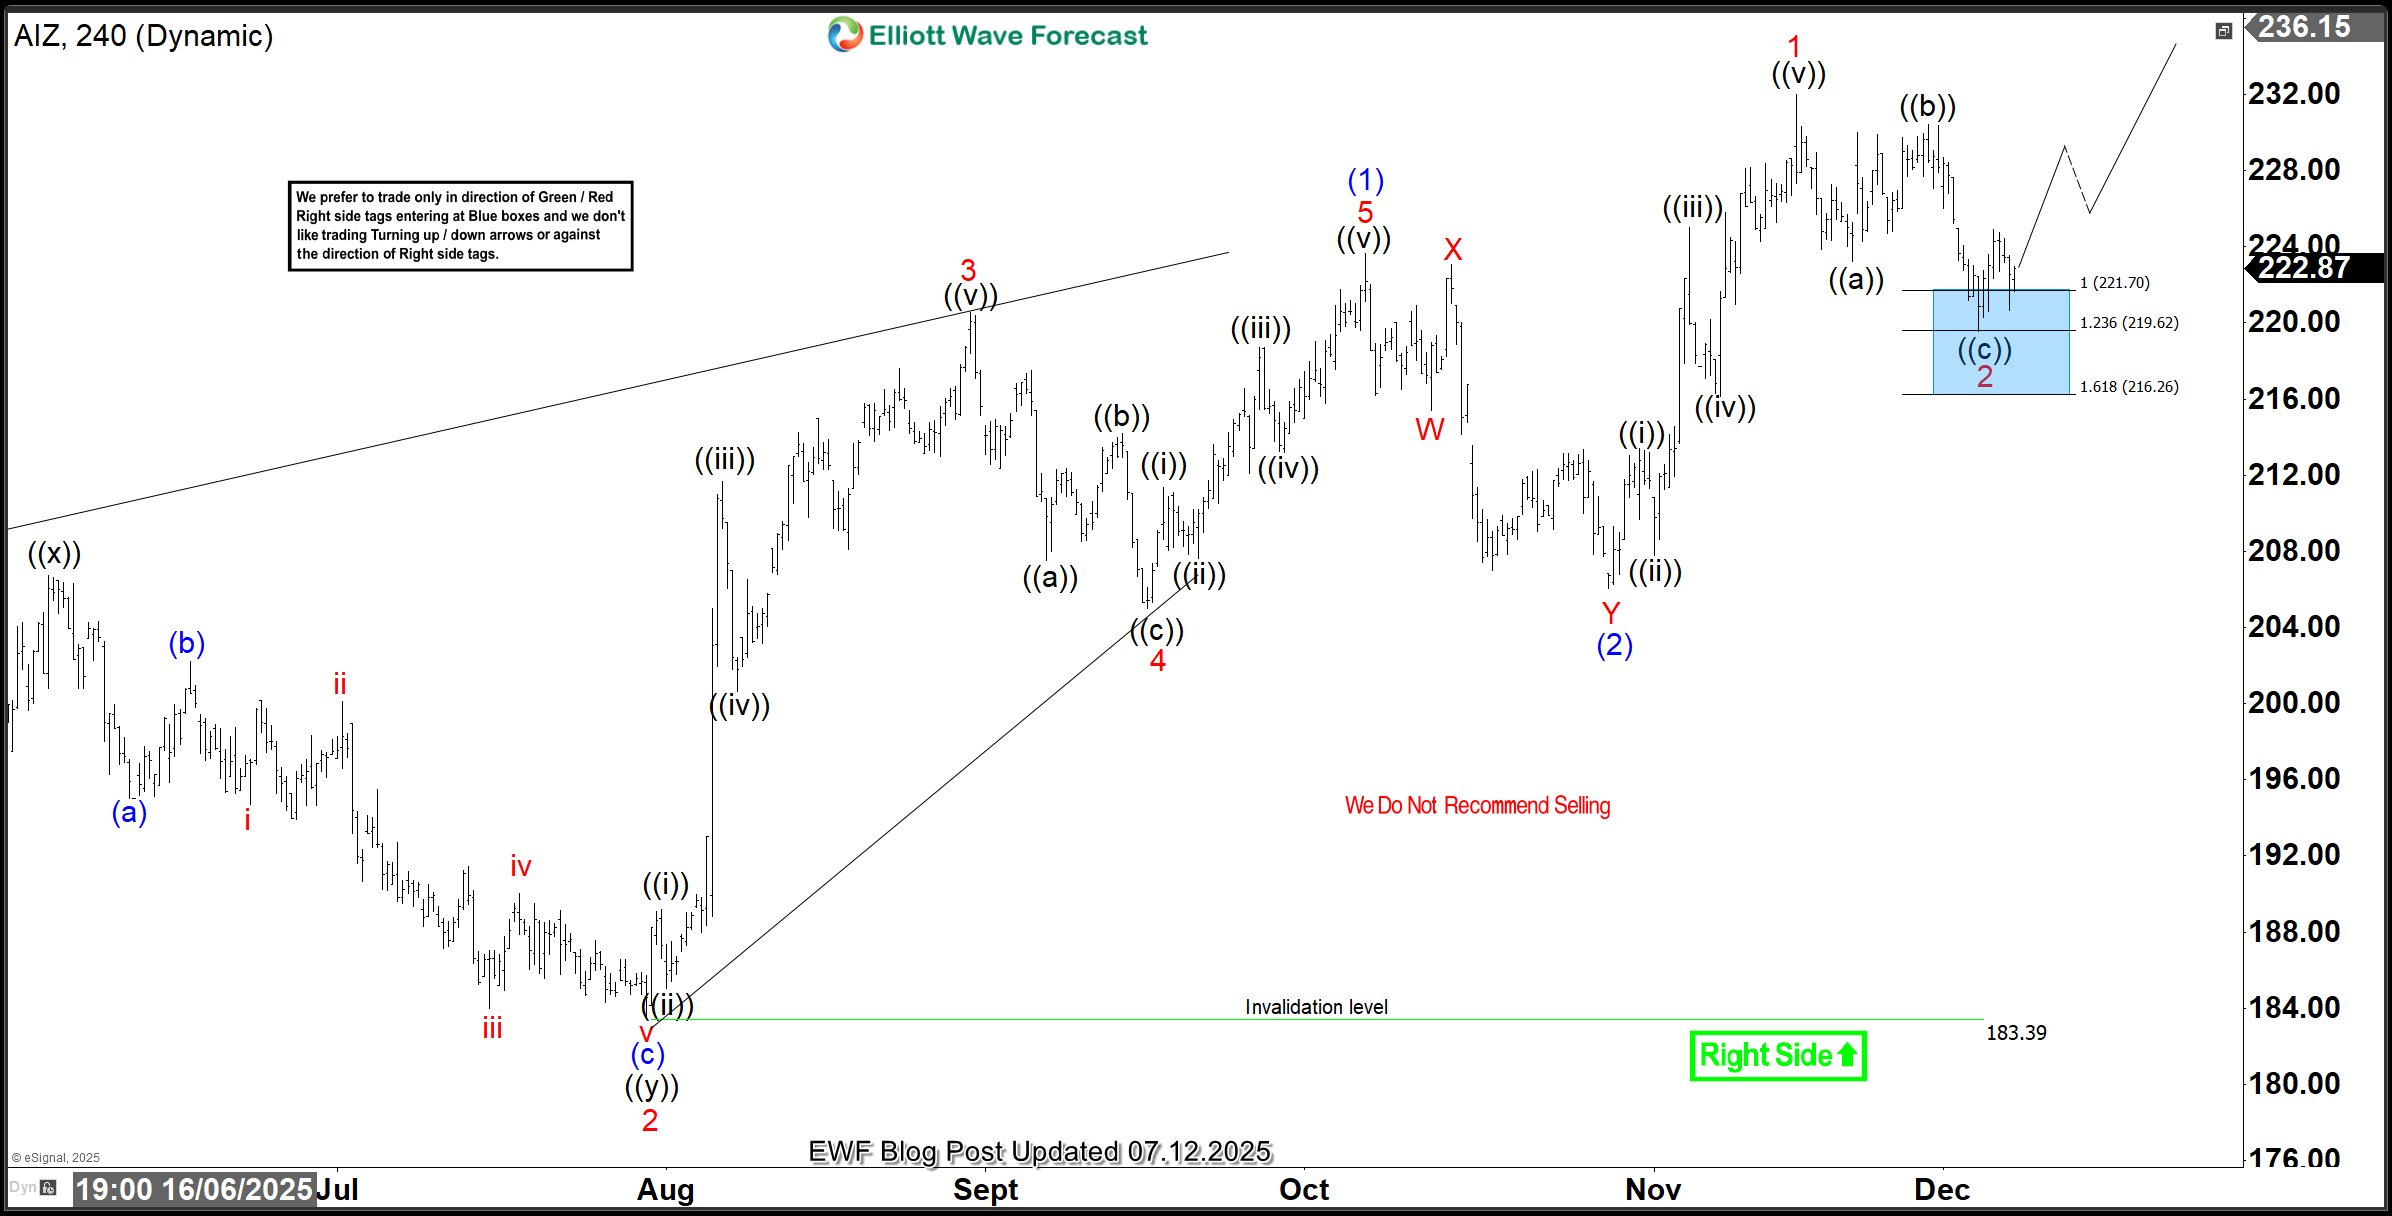
AIZ Elliott Wave Analysis: Short Term Trade Idea Aiming $250
Read MoreAIZ maintains the bullish sequence from the March 2020 low. In November, the stock broke a key resistance level and set up new opportunities for buyers from the dip targeting $250 next. This blog post explains the overall view and where buyers could find new entries. Assurant Inc. (NYSE: AIZ) is a leading global provider […]