Hello Everyone! In this technical blog, we are going to take a look at the Elliott Wave path in Occidental Petroleum Corporation ($OXY).
Occidental Petroleum Corporation is an American company engaged in hydrocarbon exploration in the United States, and the Middle East as well as petrochemical manufacturing in the United States, Canada, and Chile. It is organized in Delaware and headquartered in Houston. The company ranked 183rd on the 2021 Fortune 500 based on its 2020 revenues and 670th on the 2021 Forbes Global 2000.
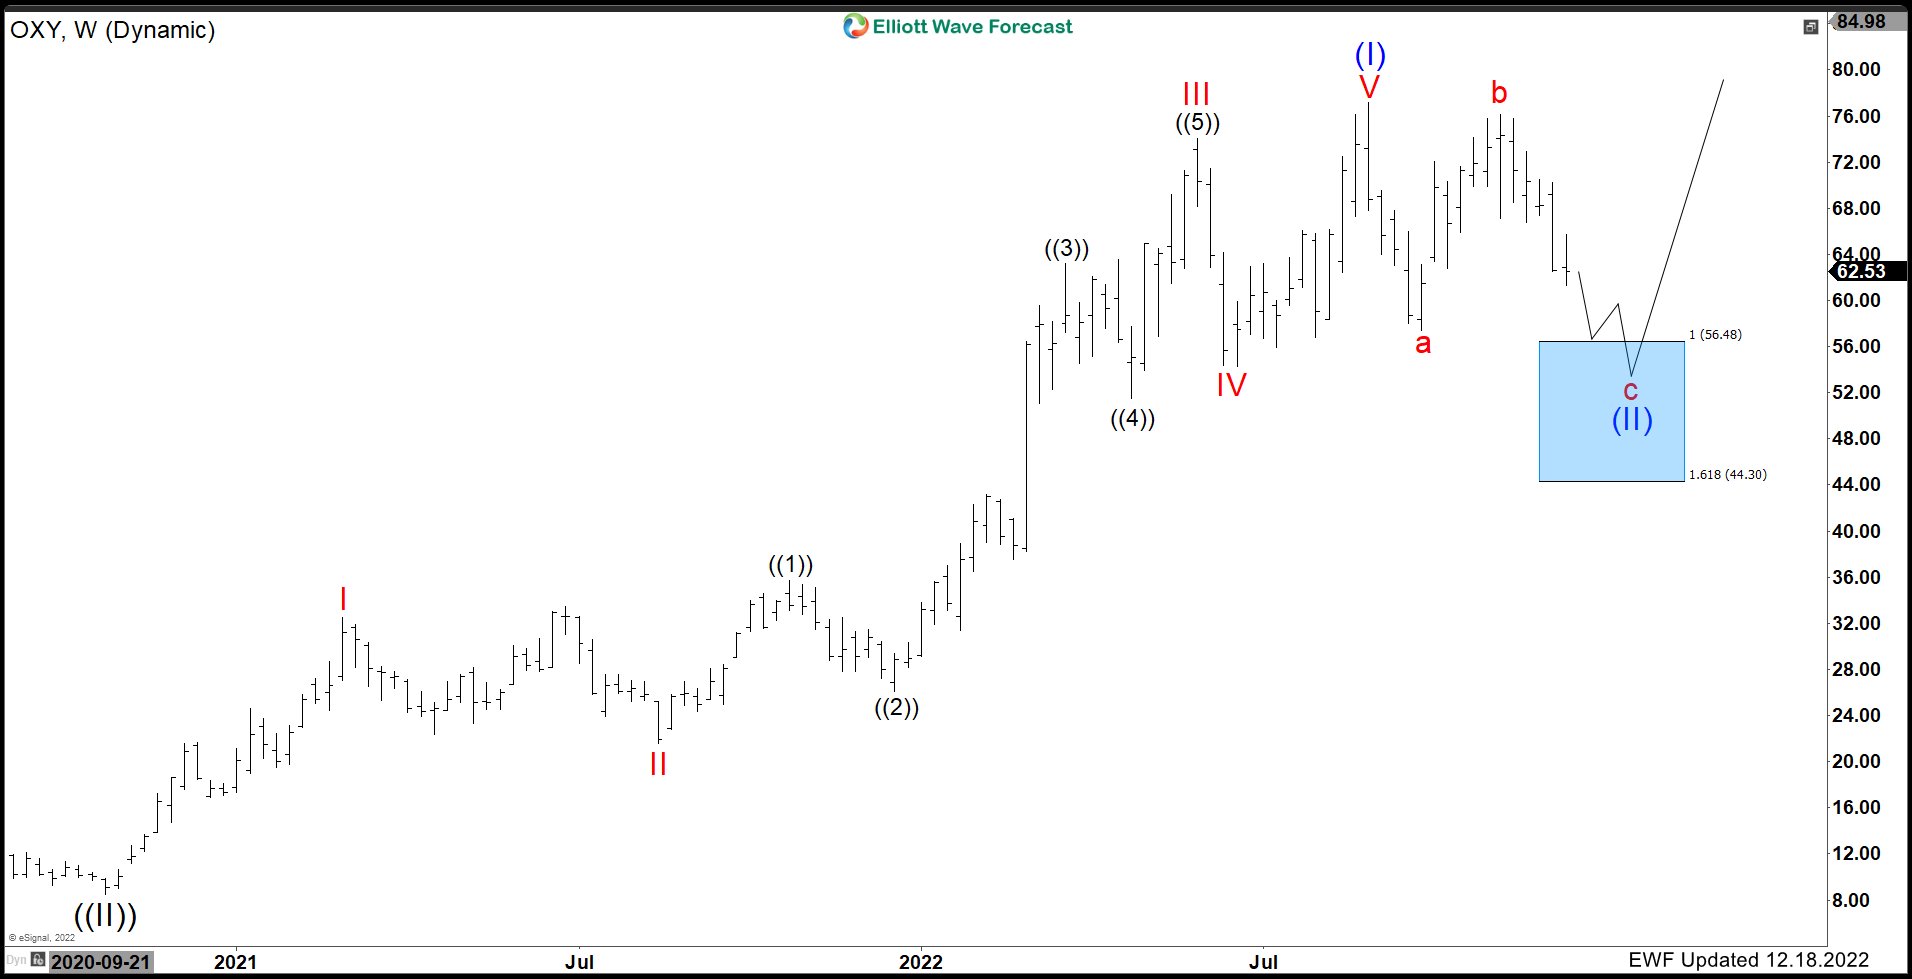
$OXY Weekly Elliott Wave Analysis Dec 18th 2022:
The Weekly Chart above shows the cycle from October 2020 low unfold in 5 waves impulse structure that ended in August 2022 at blue (I) at $77.13. The stock then started a pullback to correct the cycle against October 2020 low in a Zig Zag structure (abc). The correction so far has completed the first and second leg. As long as price remains below red b at $76.10, it is expected that the next leg lower is taking place. Any bounces should find sellers until we reach the Blue Box area at $56.48 – 44.30. We like to buy dips in 3, 7 or 11 swings into blue boxes for a continuation to the upside as long as the October 2020 lows at $8.52 remains intact.
Elliott Wave Forecast
We cover 78 instruments in total, but not every chart is a trading recommendation. We present Official Trading Recommendations in the Live Trading Room. If not a member yet, Sign Up for Free 14 days Trial now and get access to new trading opportunities. Through time we have developed a very respectable trading strategy which defines Entry, Stop Loss and Take Profit levels with high accuracy.
Welcome to Elliott Wave Forecast!
Back

