iRobot Corporation is an American advanced technology company which designs and builds military, police and home robots . However in April 2016, the corporation sold off its Defense & Security unit, with a new company being formed called Endeavor Robotics . So now it’s only focusing the work on the development of home and medical robots .
iRobot started being traded on the NASDAQ stock market exchange in November 2005, under ticker symbol IRBT. The first 3 years saw it’s stock price declining from a high of 37.90$ till it finally bottomed in March 2009 at 7$ , since then IRBT managed to rise for more then 600% in price making its investors very happy . But is it really a good time to think about owning the company stock ?
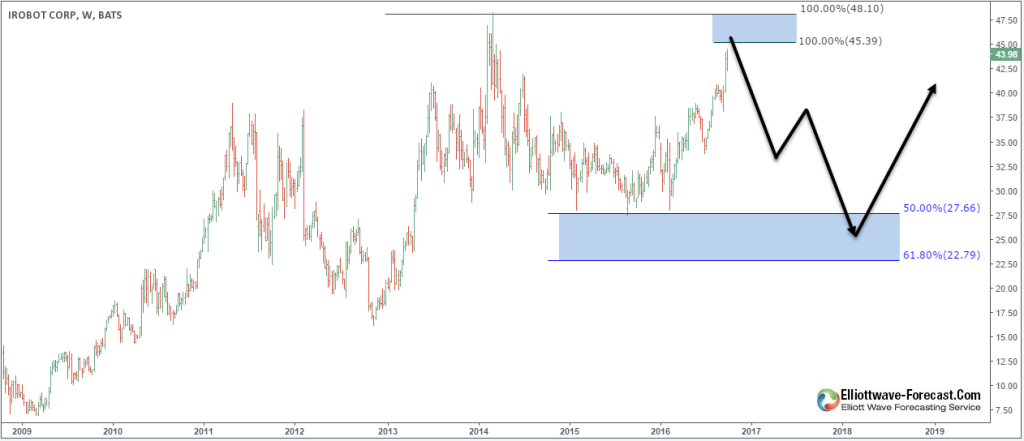
Technical look of the weekly chart is showing 7 swings from 2009 low that ended at the equal legs in 2014 peak 48.36$ before correcting 50% of the rise . While the price keeps trading below the 2014 peak, the stock still has the possibility to do a double correction lower towards 61.8% area ( 22.8$ ) , only a break above it will indicate that the correction has ended opening a new extension to the upside . The break higher will make IRBT 9 swings from the lows which is a bullish incomplete sequence in our system so after that iRobot stock will still pullback in 3 waves before resuming higher to end 11 swings from 2009 low and do a larger correction .
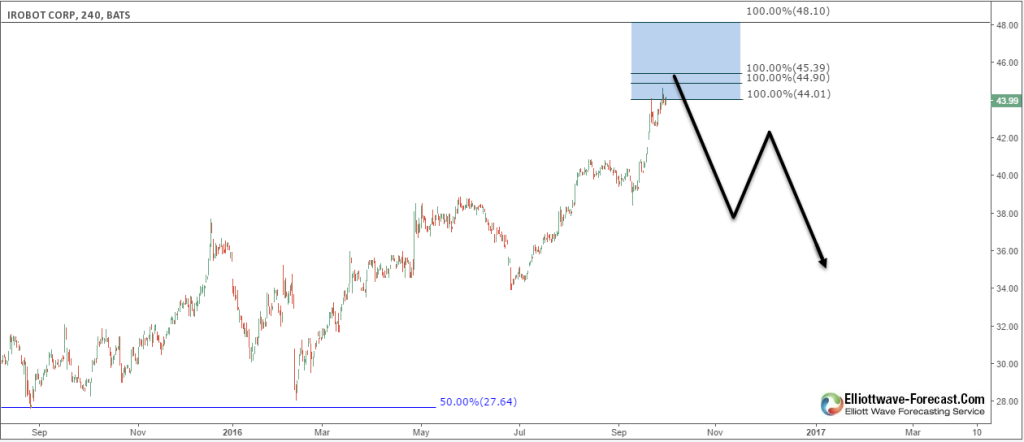
The daily chart is showing an almost mature cycle from 2015 low 27.55$ which is reaching multiple equal legs and have enough number of swings ( 7 ) to call it completed , the shorter time cycles are calling for more upside into the 45$ area so IRBT still could continue higher in the near future but will end up reversing lower either to do the double correction as proposed in the weekly chart or to make a 3 waves pullback at least .
The key level for iRobot stock remain breaking or holding 2014 peak and no matter what happens IRBT will end up doing 3 waves pullback suggesting that now isn’t really the best time to hold it’s shares as it’s approaching the end of cycle from 2015 low . So it’s better to wait for the stock to correct before buying it for another rally .
For further information on how to find levels to trade forex, indices, and stocks using Elliott Wave and the 3 , 7 or 11 swings technique, try us free for 14 days. You will get access to Professional Elliott Wave analysis in 4 different time frames, Daily Elliott Wave Setup Videos , Live Trading Room and 2 live Analysis Session done by our Expert Analysts every day, 24 hour chat room support, market overview, weekly technical videos and much more so if you are not a member yet, use this opportunity and sign up to get your free trial . If you enjoyed this article, feel free to read other diversified articles at our Technical Blogs and also check Chart of The Day .
Back


