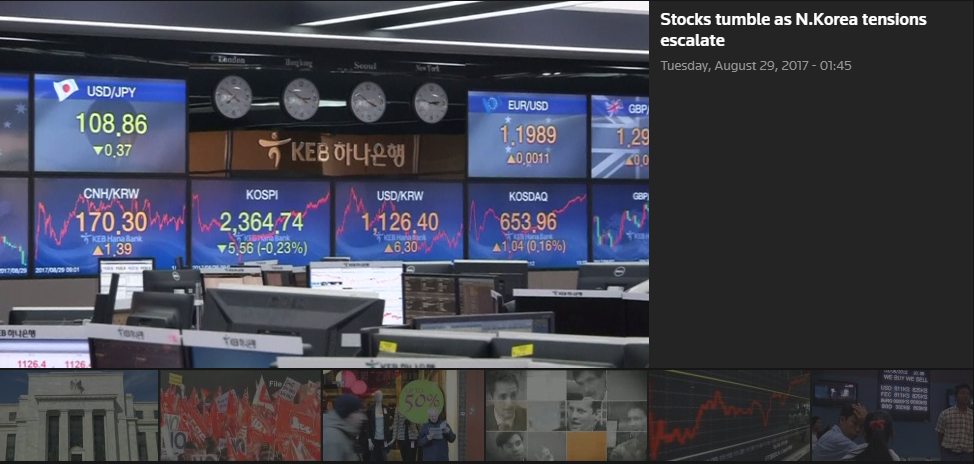
Geopolitical tensions intensified after North Korea conducted its sixth and most powerful nuclear test on Sunday, 3rd September 2017 detonating what it said was a hydrogen bomb meant for intercontinental ballistic missile. The United States warned it could launch a “massive” military response if it or its allies were threatened. Most of the Stock Markets in the World reacted negatively to the news with stocks from around the World ending the day in the red.
We believe what we saw was some panic selling and not a huge sell off. We at Elliottwave-Forecast.com believe that markets move on the basis of cycles and swing sequences and news just acts as a catalyst rather than driving the markets. We believe North Korea’s nuclear test poses little threat to the rally in Indices as mid-long term cycles are still bullish. We will present long-term view in South Korean Stock Exchange to support our view that any sell off seen due to escalating geo-political tensions is still a buying opportunity.
$KOSPI-KOR denies huge sell off due to North Korea
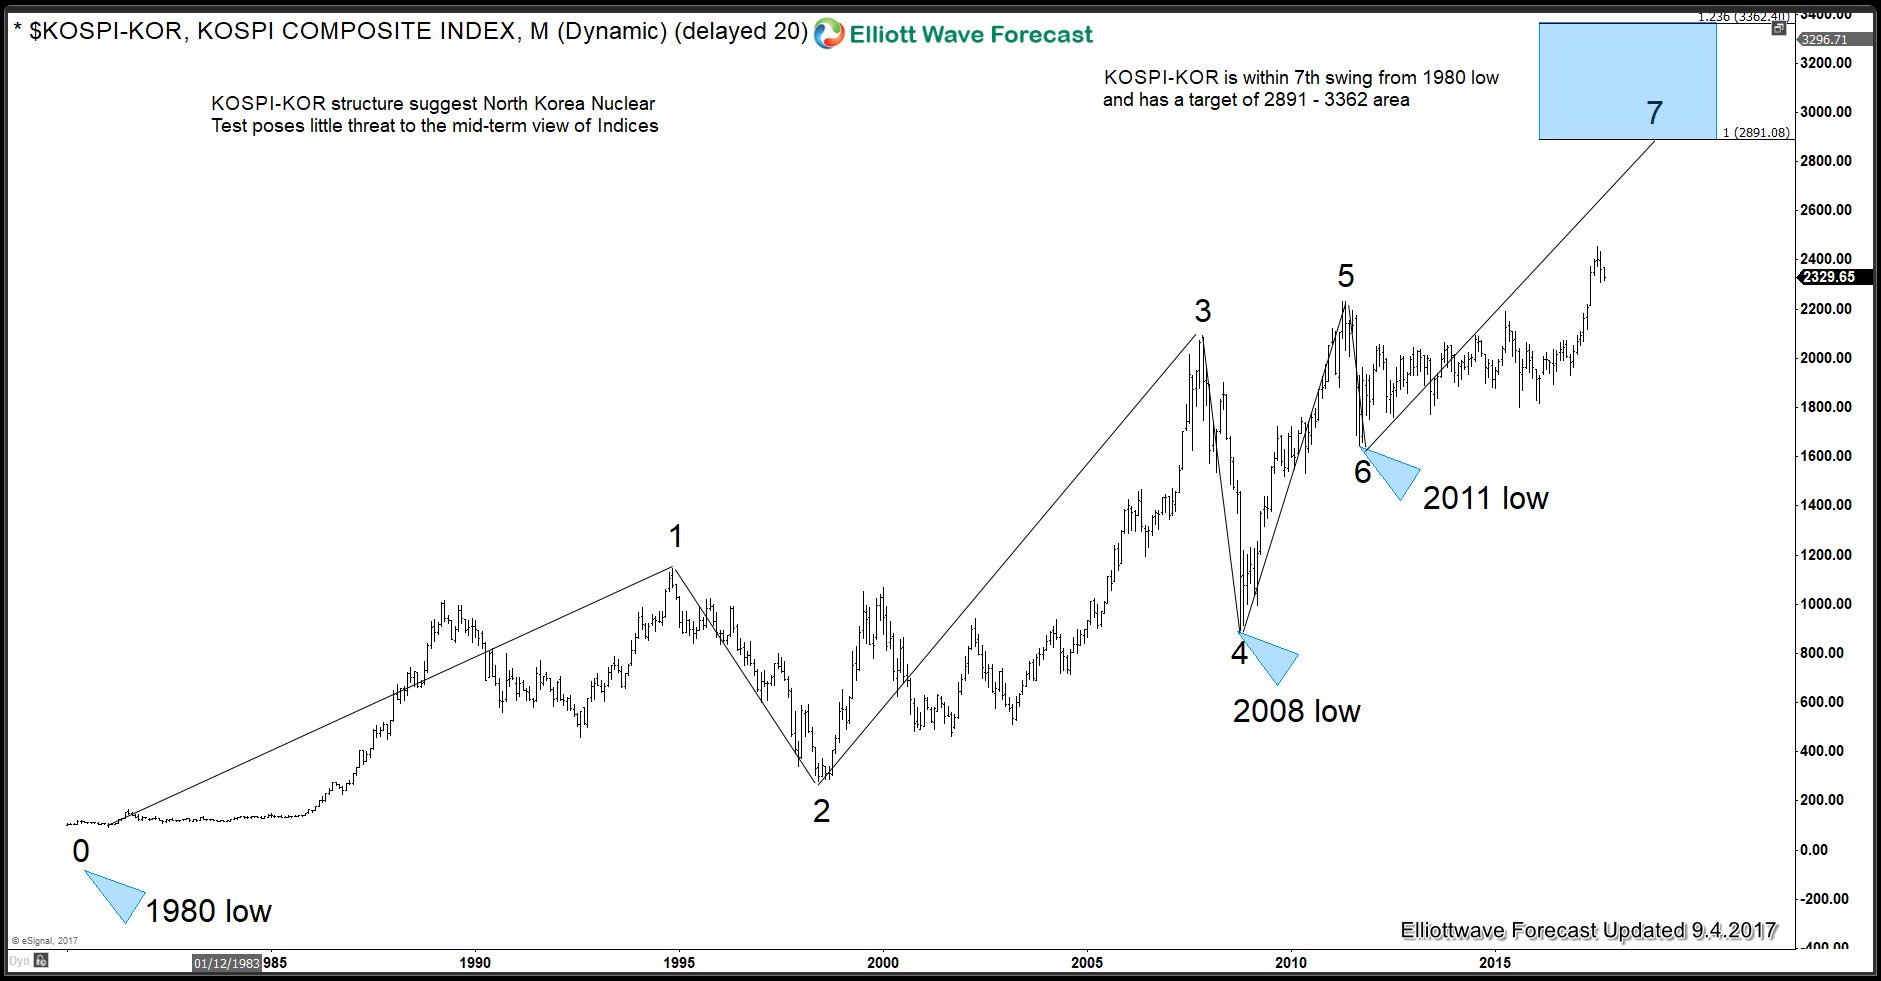
KOSPI-KOR Index from South Korea is within 7th swing from 1980 low but has not yet reached the ideal target area. Sequence from 2008 low is also incomplete and calls for more upside towards 2891 – 3362 area as far as dips hold above 2011 low. As the sequence from 1980 and 2008 low in KOSPI-KOR is incomplete, any dips remain a buy in 3, 7 or 11 swings as far as pivot at 2011 low remains intact. North Korea’s nuclear test or any military offensive should have a direct impact on South Korea’s stock exchange and as the sequence is bullish, we believe nothing drastic will come out of the current scenario, it can cause a pull back but that should be a buying opportunity looking for a move higher towards 2891 – 3362 area.
$KOSPI-KOR Long-Term Elliott Wave View
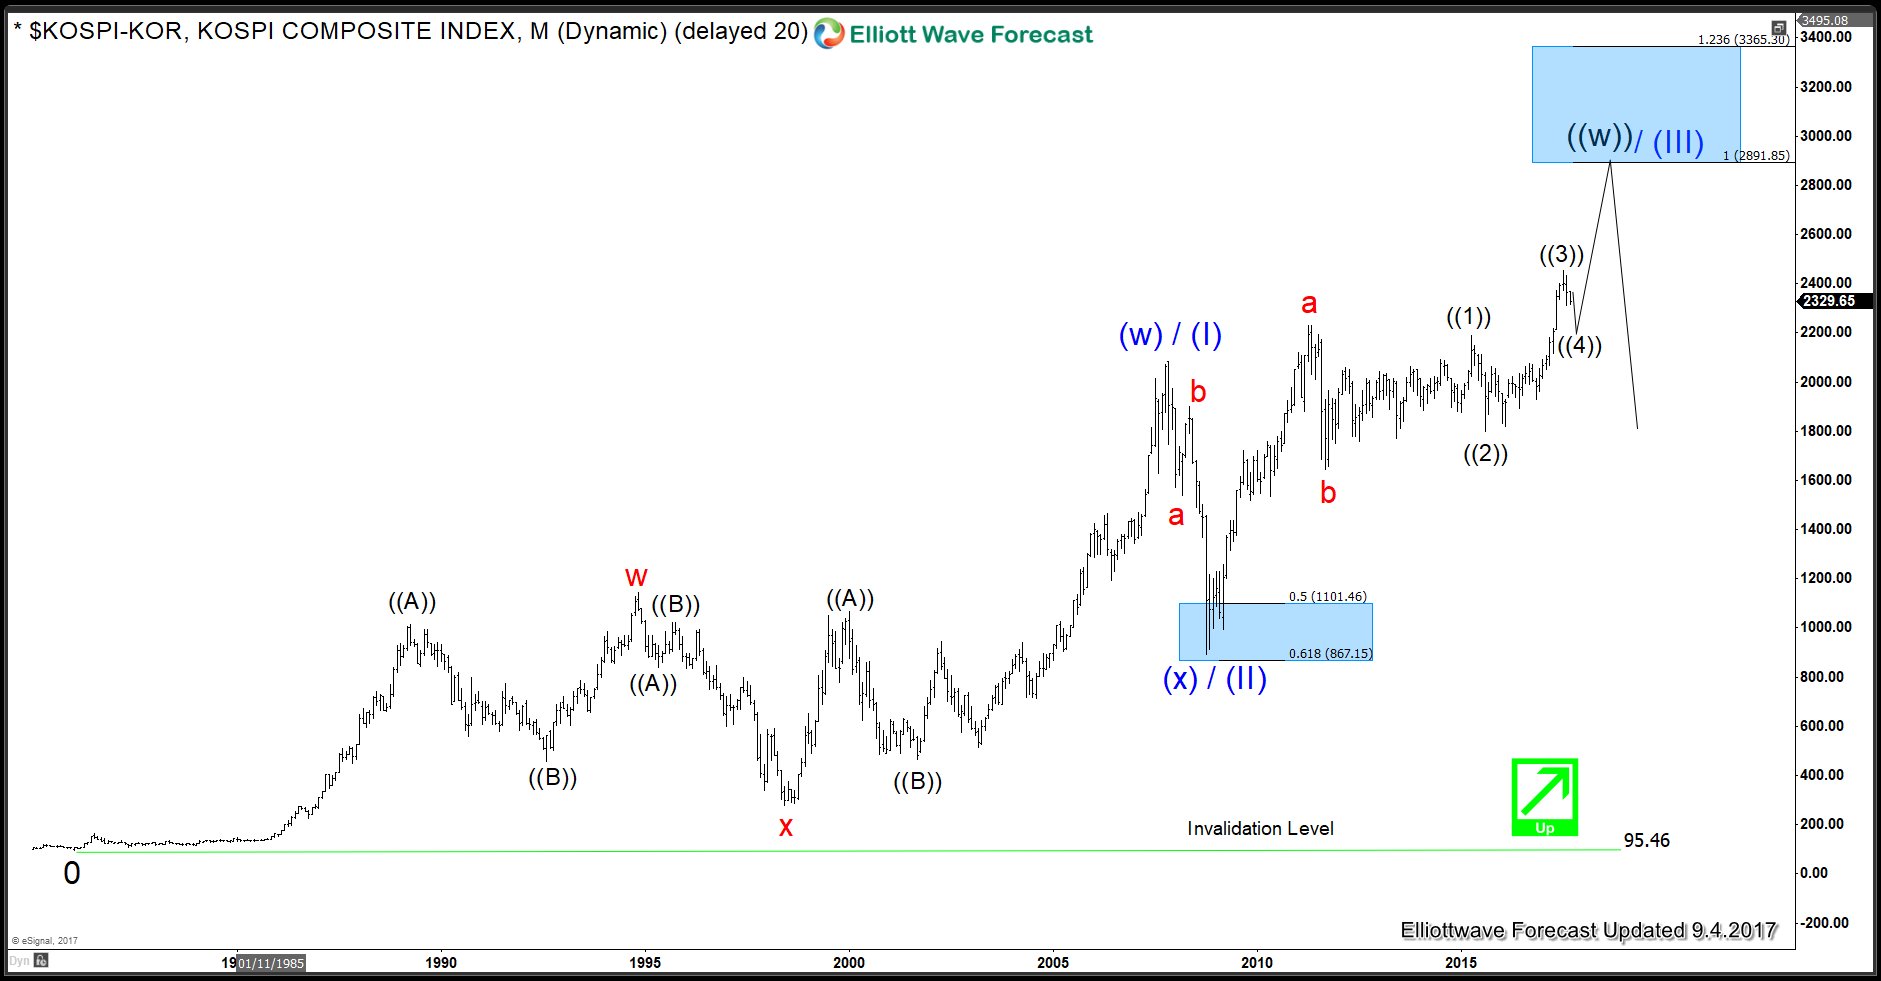
$KOSPI-KOR rally from 1980 low could be viewed as a double three Elliott wave structure or it could be viewed to be in wave (III) of an incomplete Leading Diagonal structure. In either case, rally sequence is incomplete and as dips hold above wave ((2)) and more importantly “b” low, expect the Index to resume the rally towards 2893 – 3362 area to reach the extreme from 1980 low. From this area, Index can see a larger pull back to correct the cycle from 1980 low or at least from 2008 low labelled as (x) / (II). We don’t like selling the Index and expect to see buyers appearing after dips in 3, 7 or 11 swings as far as pivot at 2015 and 2011 lows remain intact.
Back


