Nike Ticker symbol: NKE short-term Elliott wave view suggests that the pullback to $75.06 low ended intermediate wave (2). Above from there, the stock has rallied to new all-time highs confirming the next leg higher in intermediate wave (3). The internals of intermediate wave (3) higher is unfolding as Elliott wave impulse structure with the sub-division of 5 waves structure in lesser degree cycles.
Up from $75.06 low, the rally higher to $78.44 high ended Minute wave ((i)) in 5 waves structure. Below from there, the pullback to $75.43 low ended Minute wave ((ii)) pullback. Then the rally higher to $81.25 high completed the Minute wave ((iii)) is lesser degree 5 waves structure. Down from there, a pullback to $79.12 low ended Minute wave ((iv)) as a zigzag structure. Finally a rally higher to $83.68 high ended Minute wave ((v)) in 5 waves and also completed Minor wave 1. Also, it’s important to note here that instrument is showing bullish sequence tag & right side is calling for more upside, therefore, our preference remained buying the Minor wave 2 dip in 3, 7 or 11 swings against $75.06 low.
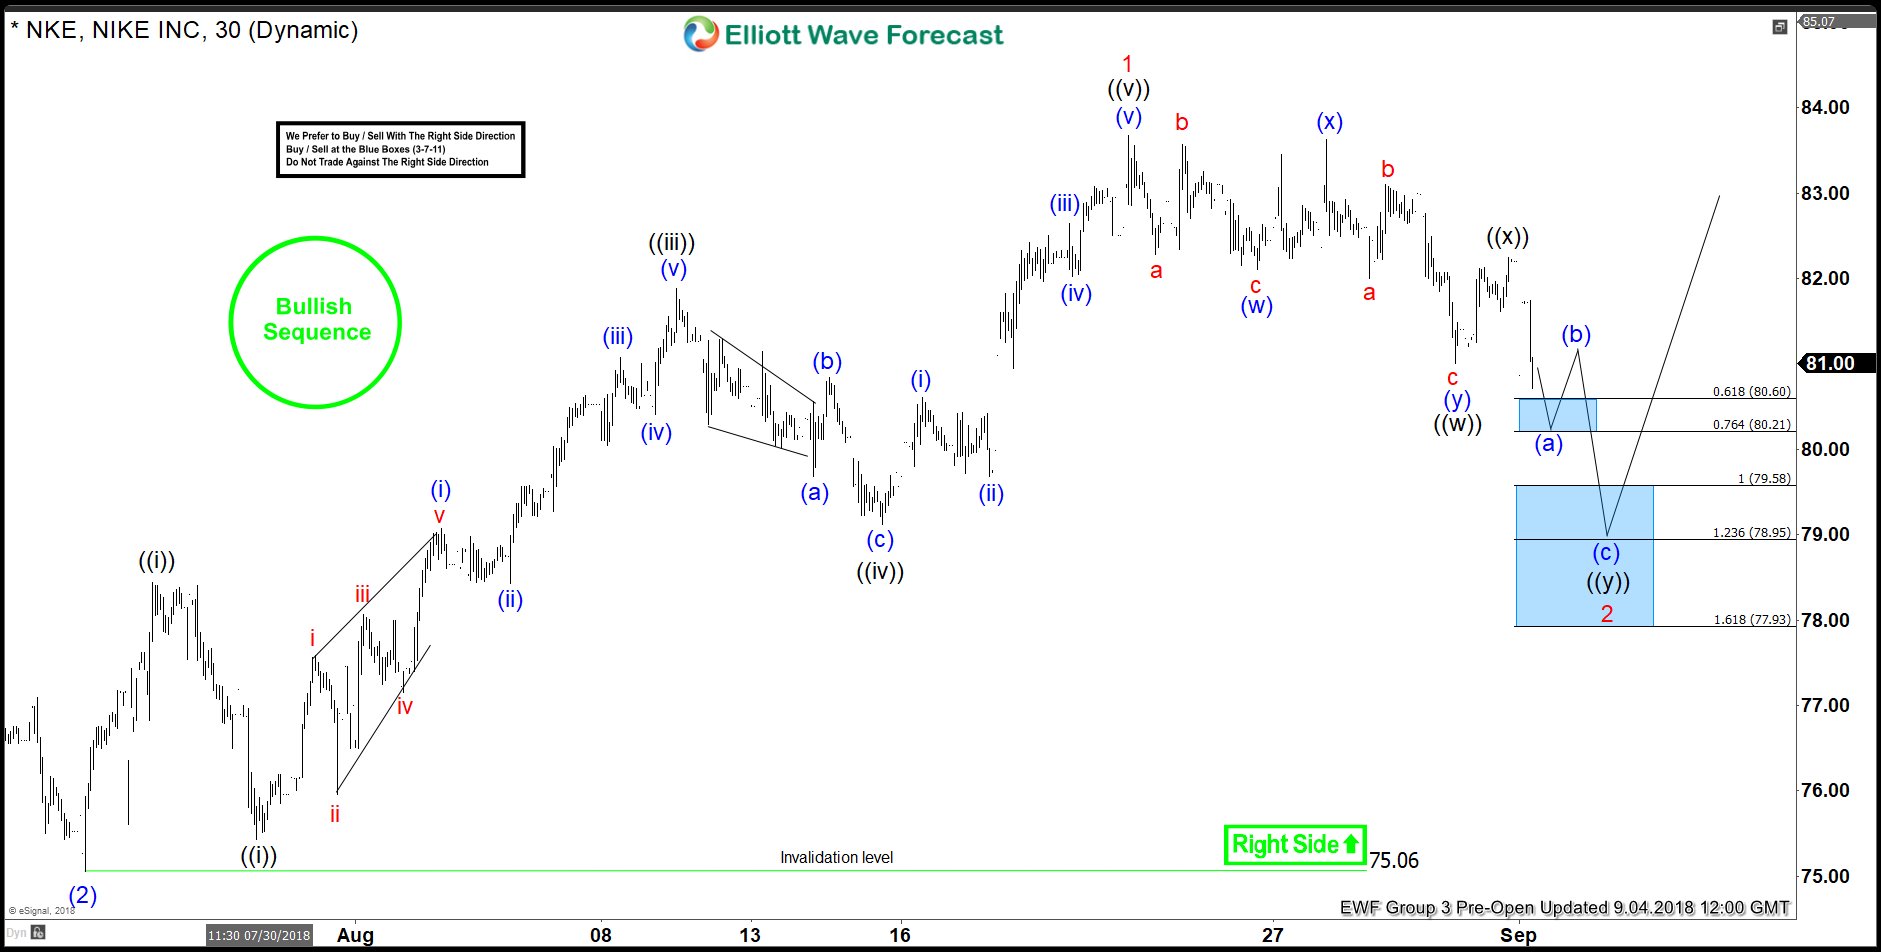
Below is the 1-hour NKE Chart from 9/04/2018 Pre-open update, in which the stock was expected to do a 7 swing correction lower as double three structure within Minor wave 2 pullback. Where Minute wave ((w)) of 2 ended at $81.01, Minute wave ((x)) ended at $82.25 high. Down from there, Minute wave ((y)) was expected to extend lower towards $79.58-$77.93 100%-161.8% Fibonacci extension area of Minute wave ((w))-((x)) to complete the Minor wave 2 pullback and provide members a buying opportunity.
NKE 1 Hour Elliott Wave Chart From 9/04/2018
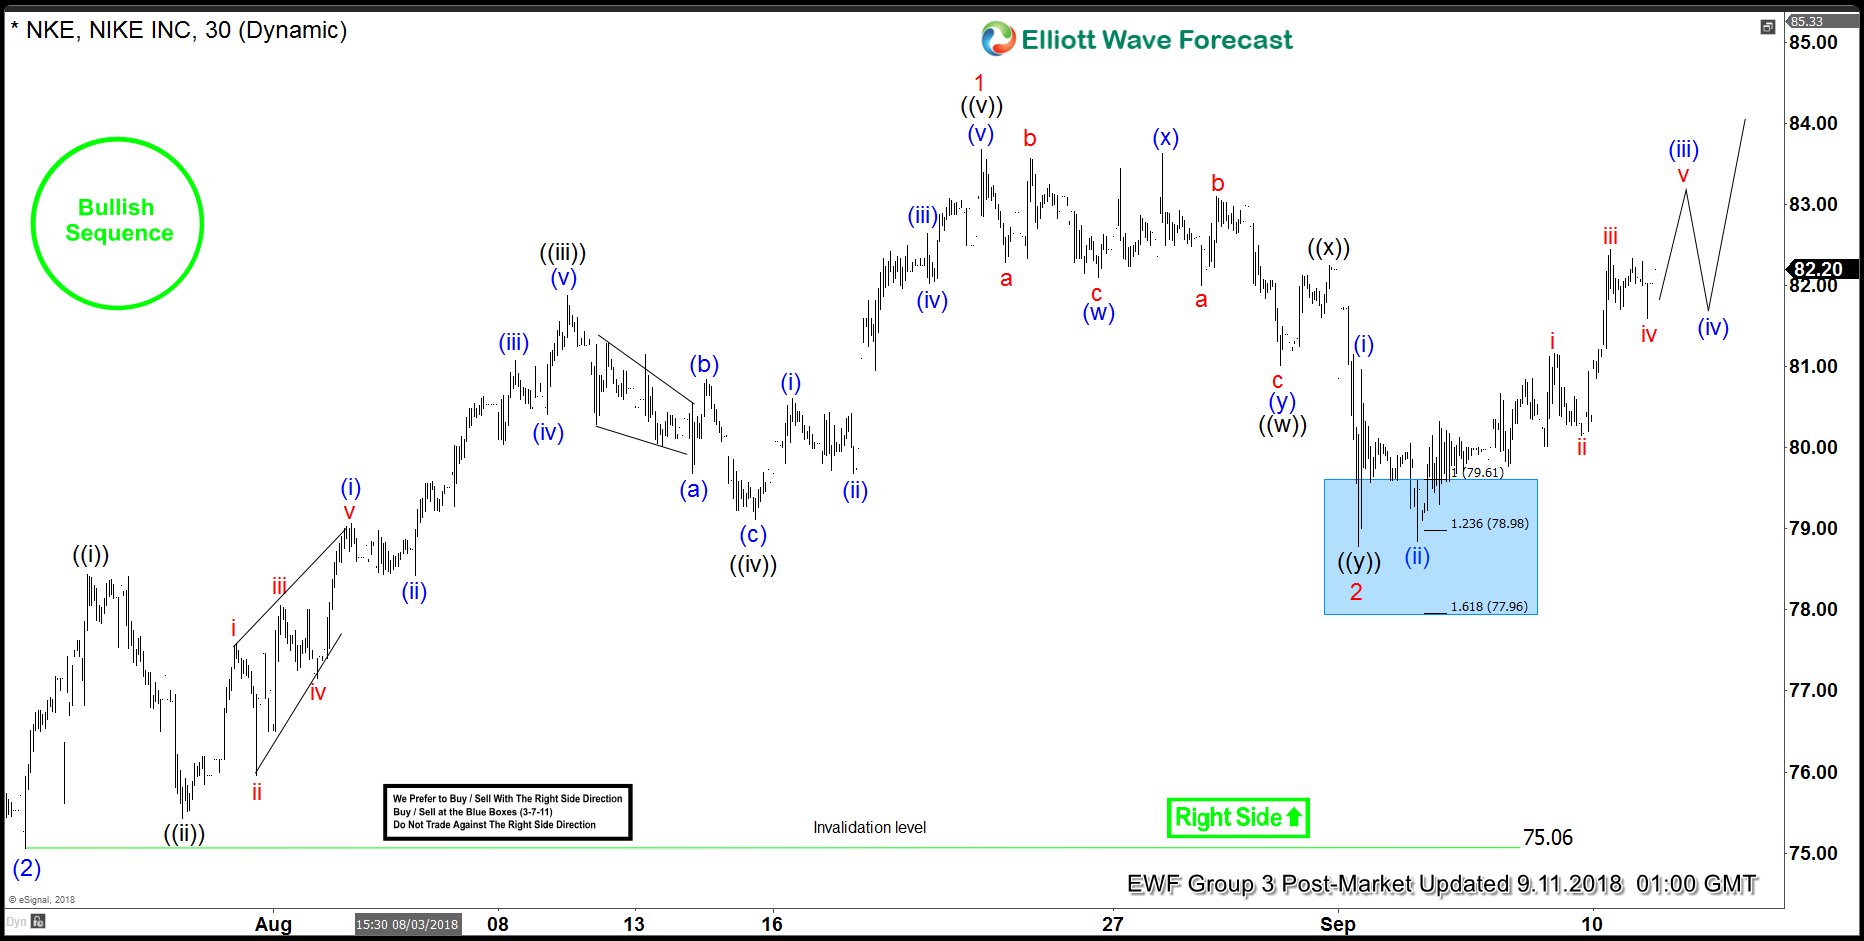
Here’s 1-hour recent NKE Chart from 9/11/2018 Post-Market update, showing the instrument reaching the blue box area & ending Minute wave ((y)) of 2 at $78.78 low, after reaching $79.58-$77.93 100%-161.8% Fibonacci extension area of Minute wave ((w))-((x)). The instrument so far has bounced strongly higher allowing our member’s to create a risk-free position (stop loss on entry level). However, a break above $83.68 Minor wave 1 high remains to be seen for final confirmation of next extension higher & to avoid double correction lower in Minor wave 2 pullback. We don’t like selling it and prefer staying long from $79.58 100% ext area with a risk-free position.
NKE 1 Hour Elliott Wave Chart 9/11/2018
Keep in mind that the market is dynamic and the view could change in the meantime. Success in trading requires proper risk and money management as well as an understanding of Elliott Wave theory, cycle analysis, and correlation. We have developed a very good trading strategy that defines the entry. Stop loss and take profit levels with high accuracy and allows you to take a risk-free position, shortly after taking it by protecting your wallet. If you want to learn all about it and become a professional trader, then join our service with a special summer promotion.
Back


