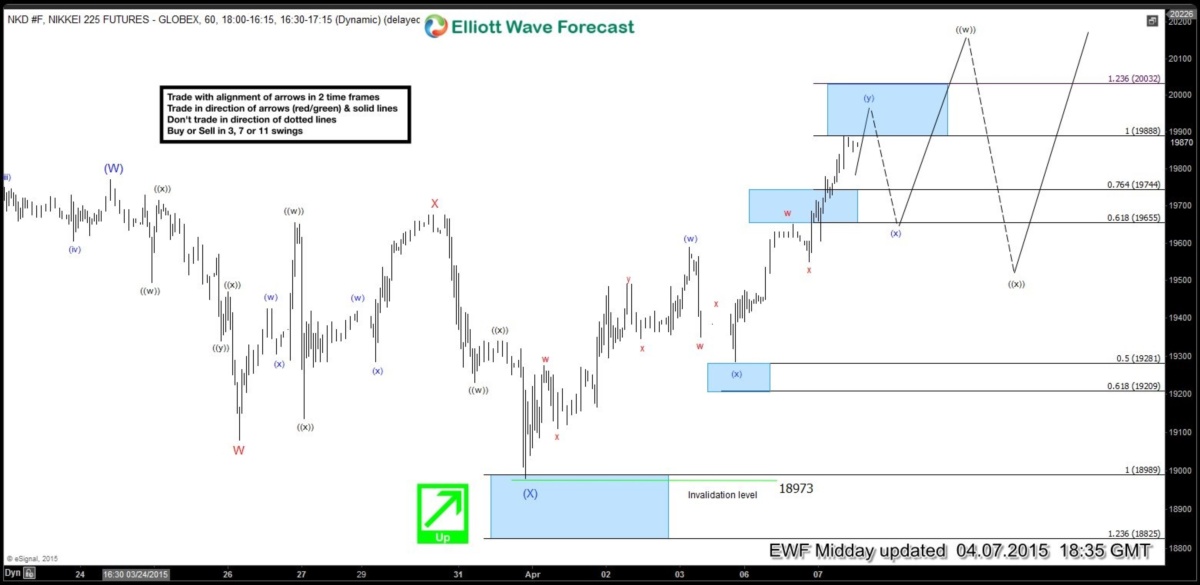
Preferred Elliott Wave view suggests rally to 19770 completed wave (W) and wave (X) pull back is also proposed to be over at 18973 with a test of equal legs (100% Fibonacci extension). As per Chart of the day presented yesterday (4.6.2015), we were looking for higher prices toward 19888 – 20032 area to complete a (w)-(x)-(y) structure. This area has been hit but market correlation suggests up move is likely to extend and become a triple three Elliott wave structure i.e. (w)-(x)-(y)-(z). We view the Index to be ending wave (y) between 19888 – 20032 area and then pull back in wave (x) to correct the rally from 19285 low. After that expect another swing higher toward 20100 – 20200 area to complete a cycle from 18973 low. As the pull back is represented with a dashed line accompanied by a green arrow, we don’t like selling the Index and expect the Index to find buyers in the dip in 3, 7 or 11 swings as far as prices holds above 19285 low and more importantly the pivot at 18973 low remains intact.
We do Elliott Wave Analysis of 41 instruments in 4 time frames (Weekly, Daily, 4 Hour and 1 Hour) with 1 hour charts updated 4 times a day so clients are always in loop for the next move. Please feel free to come visit around the website and click Here to Start your 14 day Trial (No commitments, Cancel Anytime).
Back

