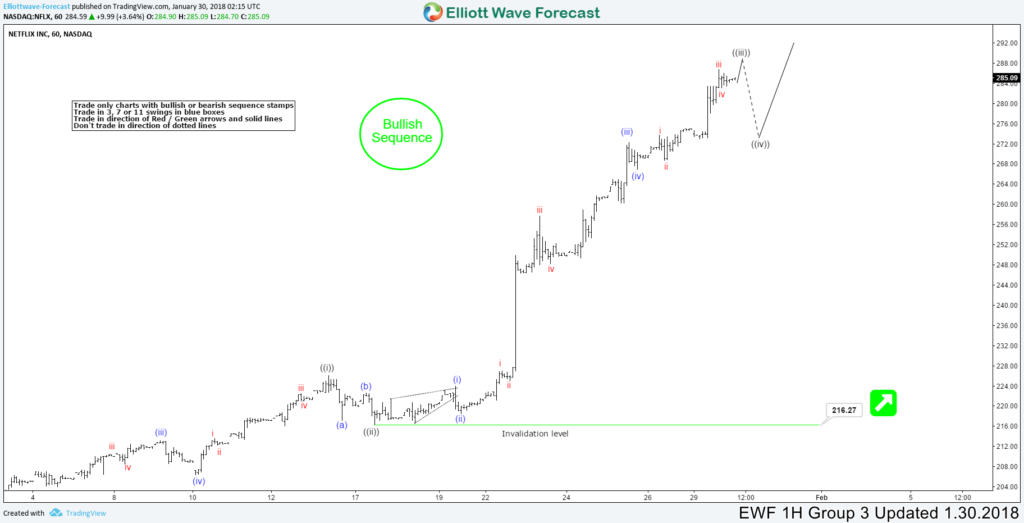
Netflix stock symbol: (NFLX ) Short Term Elliott Wave view suggests that the cycle from December 06. 2017 low is extending higher as an Impulse sequence with extension in Minute wave ((iii)) higher. When each leg has an internal distribution of 5 waves thus favoring it to be an impulse. These 5 waves move higher should end either the Minor wave 3 higher or wave A higher of a Zigzag structure in an Impulse sequence. Afterwards, the instrument should do a pullback in 3, 7 or 11 swings against December 06 cycle either in Minor wave 4 or wave B of a Zigzag structure. Then should do another extension higher either in Minor wave 5 or wave C of a Zigzag structure.
A rally from December 06.2017 low to 225.94 high ended Minute wave ((i)) in the stock than the dip to 216.27 ended Minute wave ((ii)). Above from there, the rally came out strong in Minute wave ((iii)) with each leg showing the internal distribution of an Impulse. After having 1 more push higher in the stock it’s expected to see a Minute wave ((iv)) pullback. Which should then see buyer’s again in 3, 7 or 11 swings for further upside extension in it. We don’t like selling it and prefer buying the Minute wave ((iv)) dip when seen in 3, 7 or 11 swings provided the pivot at 216.27 low stays intact.
Netflix (NFLX) 1 Hour Elliott Wave Chart
Keep in mind that the market is dynamic and the view could change in the meantime. Success in trading requires proper risk and money management as well as an understanding of Elliott Wave theory, cycle analysis, and correlation. We have developed a very good trading strategy that defines the entry.
Stop loss and take profit levels with high accuracy and allows you to take a risk-free position, shortly after taking it by protecting your wallet. If you want to learn all about it and become a professional trader then avail instantly the 30% discount promotion on All Monthly plan here.
Back


