NEM Could Newmont Mining Begin a Larger Bullish Cycle Soon?
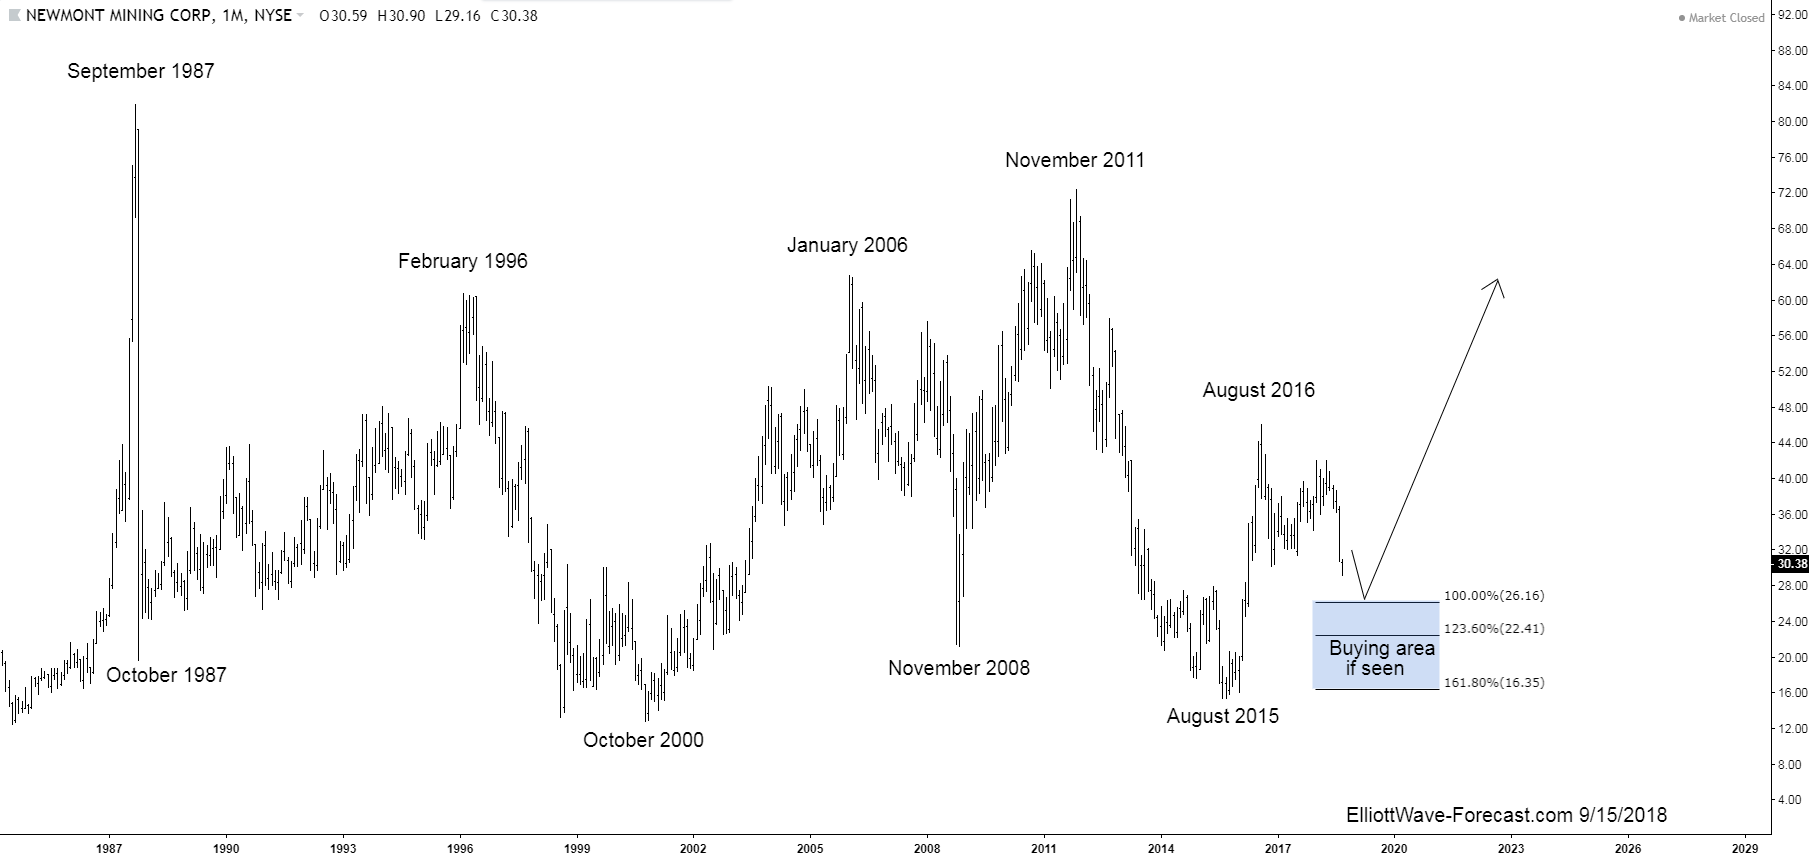
Could Newmont Mining Begin a Larger Bullish Cycle Soon? In short answer form is yes. The area from where I think that will happen from is highlighted on the chart below. Before getting to that point again later I would like to talk about some of the larger cycles in previous years that suggest that area.
Firstly from the beginning of price data from back in the 1970’s not shown on the chart, the price trend was obviously up. It ended that bullish cycle in September 1987 and pulled back really hard during the October 1987 crash. Price stabilized from there several years into the 1996 highs before another cycle lower into the October 2000 lows. That swing lower finished a correction of the cycle up from the all time lows. Those lows are still intact. The bounce that developed from the October 2000 lows into the January 2006 highs appears to have been an Elliott Wave impulse of five waves.
Secondly the three large swings from the January 2006 highs down to November 2008 lows appears to be the beginning of a large flat 3-3-5 structure. From the November 2008 lows back up to the November 2011 highs was likely be a zig-zag structure by itself. The decline from the November 2011 highs down to the August 2015 lows appeared to be five waves to complete the 3-3-5 flat structure. Of note, the lows from October 2000 remained intact again suggesting the August 2015 lows finished correcting that cycle up from there. This August 2015 low should remain intact during the current pullback.
The analysis continues below the chart.
Monthly Chart
Thirdly in conclusion the aforementioned lows from August 2015 should remain intact during the current pullback. The bounce from those lows definitely ended the cycle lower. The bounce to the August 2016 high appeared to be five waves up. This was similar to the October 2000 to January 2006 bounce although of smaller degree. The pullback lower from the August 2016 high internals are not that important however it is obviously three swings. While price is below the January 2018 high at 42.04 the Fibonacci extension area for the pullback is the 26.16-22.41. Thus far that is where the technicals suggest the rally back higher should come from.
Thanks for looking. Feel free to come visit our website to check out our services Free for 14 days .
Kind regards & good luck trading.
Lewis Jones of the ElliottWave-Forecast.com Team
Back

