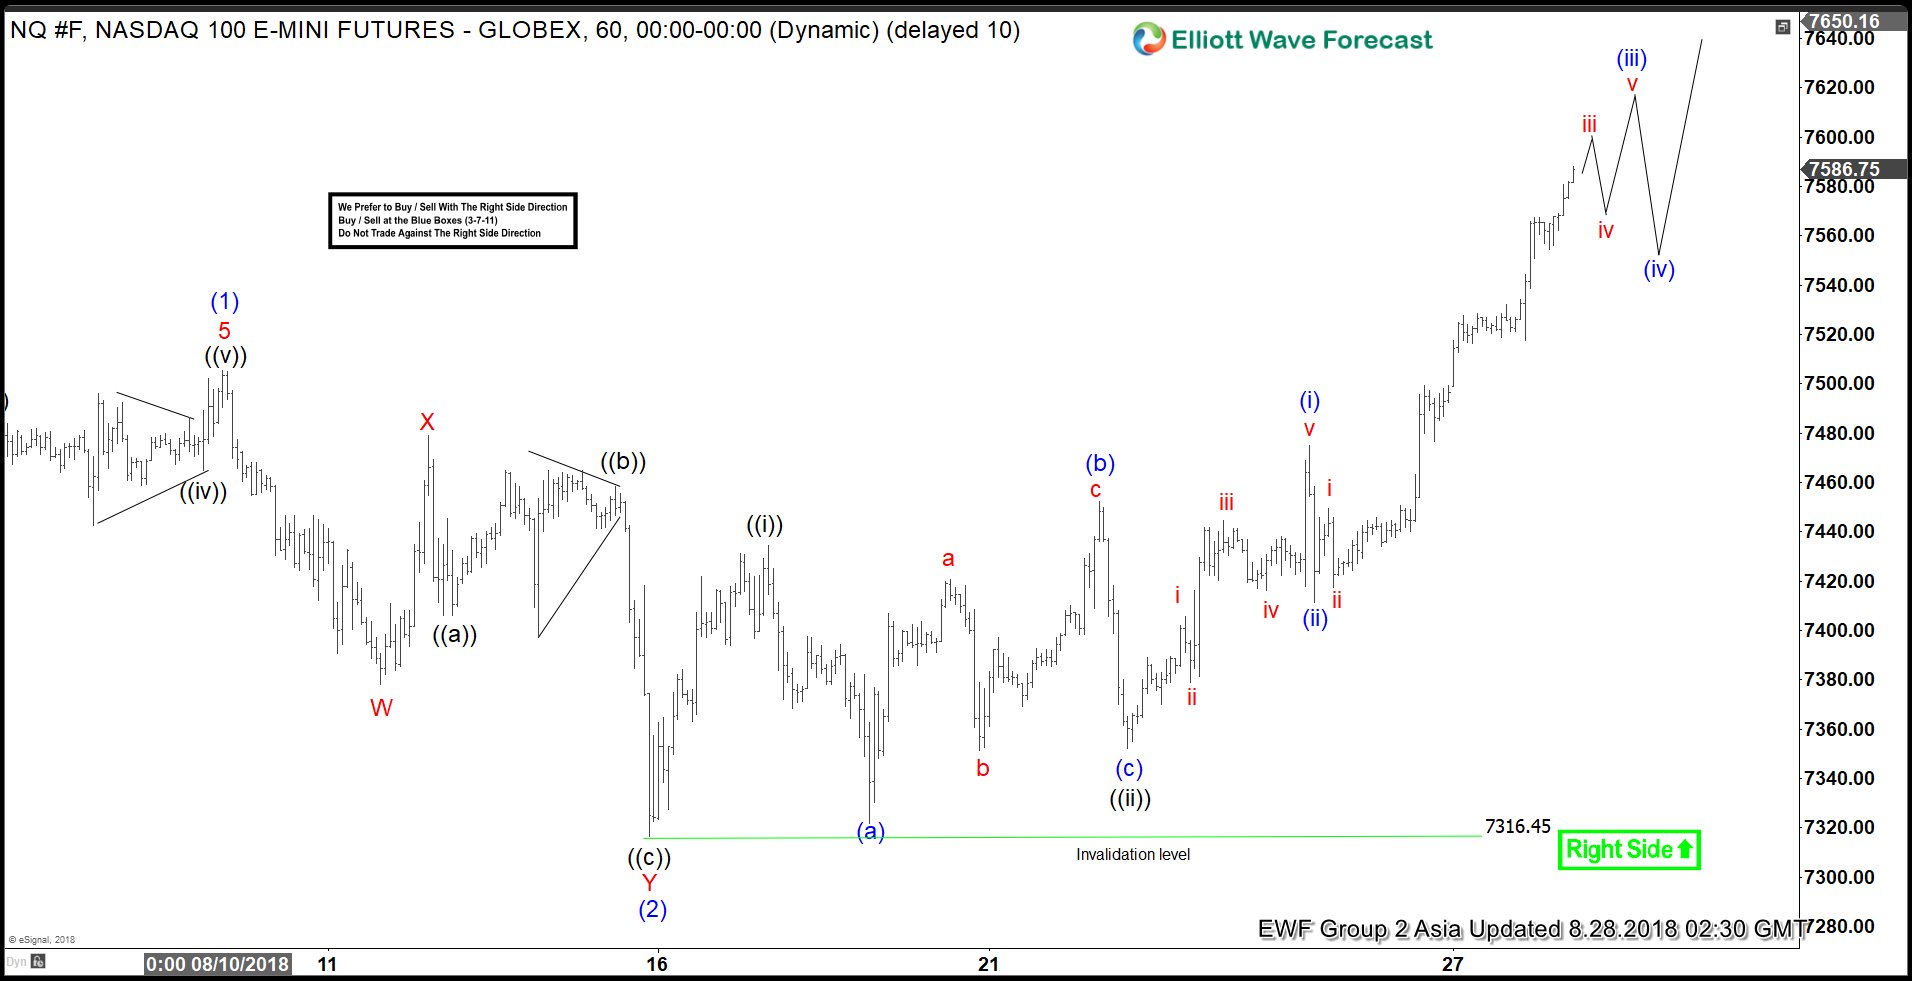
NASDAQ ticker symbol: $NQ_F short-term Elliott wave analysis suggests that the rally from 7/30 low ($7167.75) to $7505.25 high ended Intermediate wave (1). The internals of lesser degree cycles within Intermediate wave (1) unfolded as 5 waves impulse structure. Down from there, the correction against that cycle in Intermediate wave (2) pullback is proposed complete at $7316.5 low. The subdivision of Intermediate wave (2) unfolded as double three structure. Where Minor wave W ended at $7378.25. The rally to $7479 high ended Minor wave X. And the decline to $7316.45 low ended Minor wave Y of (2).
Above from there, the NASDAQ has already made a new all-time high confirming the next extension higher in Intermediate wave (3) higher has started. The internals of the rally higher is unfolding as 5 waves impulse structure. Where Minute wave ((i)) ended in 5 waves at $7433.5 high. Then the pullback to $7352 low ended Minute wave ((ii)) pullback as a Flat structure. Up from there, the index is nesting higher in Minute wave ((iii)) with lesser degree cycles showing 5 wave advance. Near-term, as far as a pivot from $7316.45 low remains intact index is expected to see more upside. We don’t like selling it and expect buyers to appear in 3, 7 or 11 swings against $7316.45 low in the first degree.


