The Micex Index Long Term Bullish Trend and Cycles
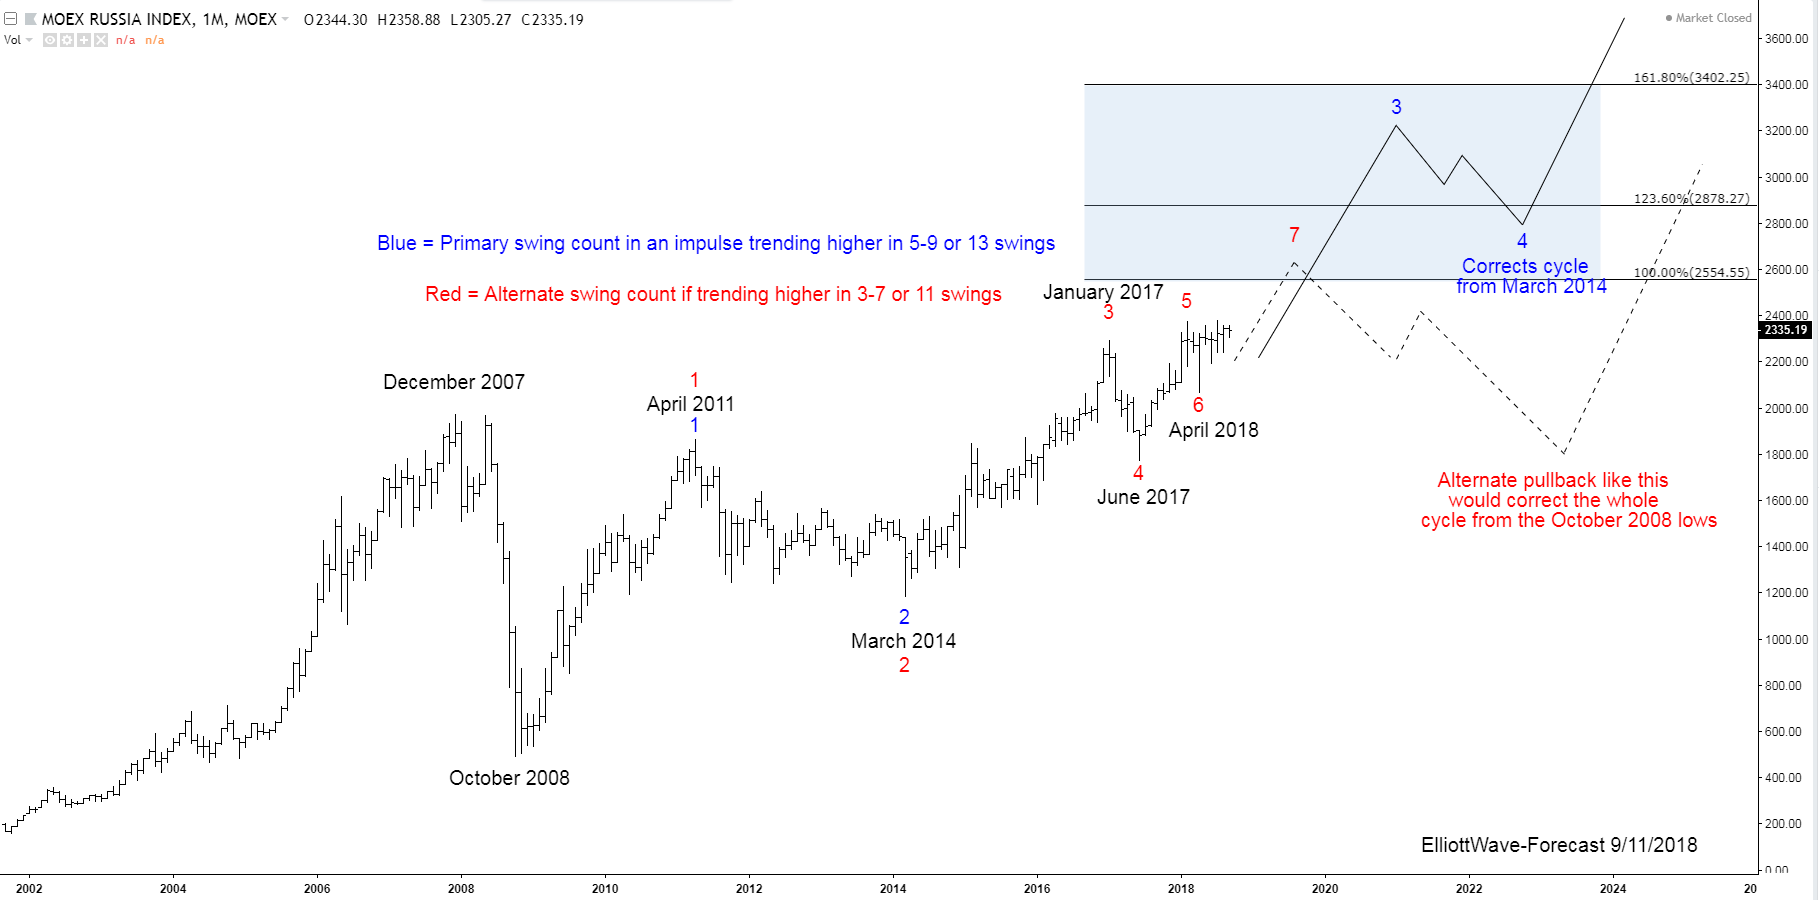
The Micex index has trended higher with other world indices since inception. The index remained in a long term bullish trend cycle into the December 2007 highs. It made a sharp correction lower in 2008 that lasted until October 2008 similar to other world indices. That is where the index corrected the whole decades long bullish cycle. Thus the October 2008 lows is from where this bullish cycle and swing analysis will begin.
Firstly from the October 2008 lows the index rose into the April 2011 highs. Then the index saw an almost 3 year long correction of that cycle into the March 2014 lows. That pullback corrected the whole cycle up from the 2008 lows. From those 2014 lows is where the alternate swing count begins which is bullish as well. Both the preferred primary swing count or alternate count the index should remain above the April 2018 lows.
The analysis continues below the chart.
Monthly Chart
Secondly as it relates to Elliott Wave I would like to mention some rules we follow. The index can continue higher toward the 2878-3402 region in the favored view while it is above the April 2018 lows. We follow a rule that suggests a wave three will be Fibonacci extension 161.8% or more of the preceding wave one. That impulse rule is a reason it should reach the upper end of the 2878-3402 area in the preferred blue 3. Then it can see a relatively shallow pullback. In the blue 4 swing correction lower against an impulse higher it normally pulls back to around .236-.382 fib of the blue 3. Afterward it should continue higher again in the fifth swing.
Third in conclusion. I would like to mention a rule we follow in the alternative swing count. When a market moves in 3-7 or 11 swings it usually ends up near the 100% equal legs to 123.6% Fibonacci extension area of the 1st & 2nd swing. This index price action barely stalled when it reached .618 Fibonacci extension of the 1st & 2nd swing. Also usually price will pull back deeper against the 2nd swing low. Other correlated indices markets are bullish and the price action of this one suggests the primary view. Pullbacks should remain relatively shallow. While the momentum indicators suggesting price stays above the April 2018 lows it should continue higher in the preferred swing count.
Thanks for looking and feel free to come visit our website and check out our services Free for 14 days and see if we can be of help.
Kind regards & good luck trading.
Lewis Jones of the ElliottWave-Forecast.com Team
Back

