JPMorgan Chase & Co. (JPM) is an American multinational investment bank and financial services holding company headquartered in New York City and incorporated in Delaware. As of December 31, 2021, JPMorgan Chase is the largest bank in the United States, the world’s largest bank by market capitalization, and the fifth-largest bank in the world in terms of total assets, with total assets totaling to US$3.831 trillion.
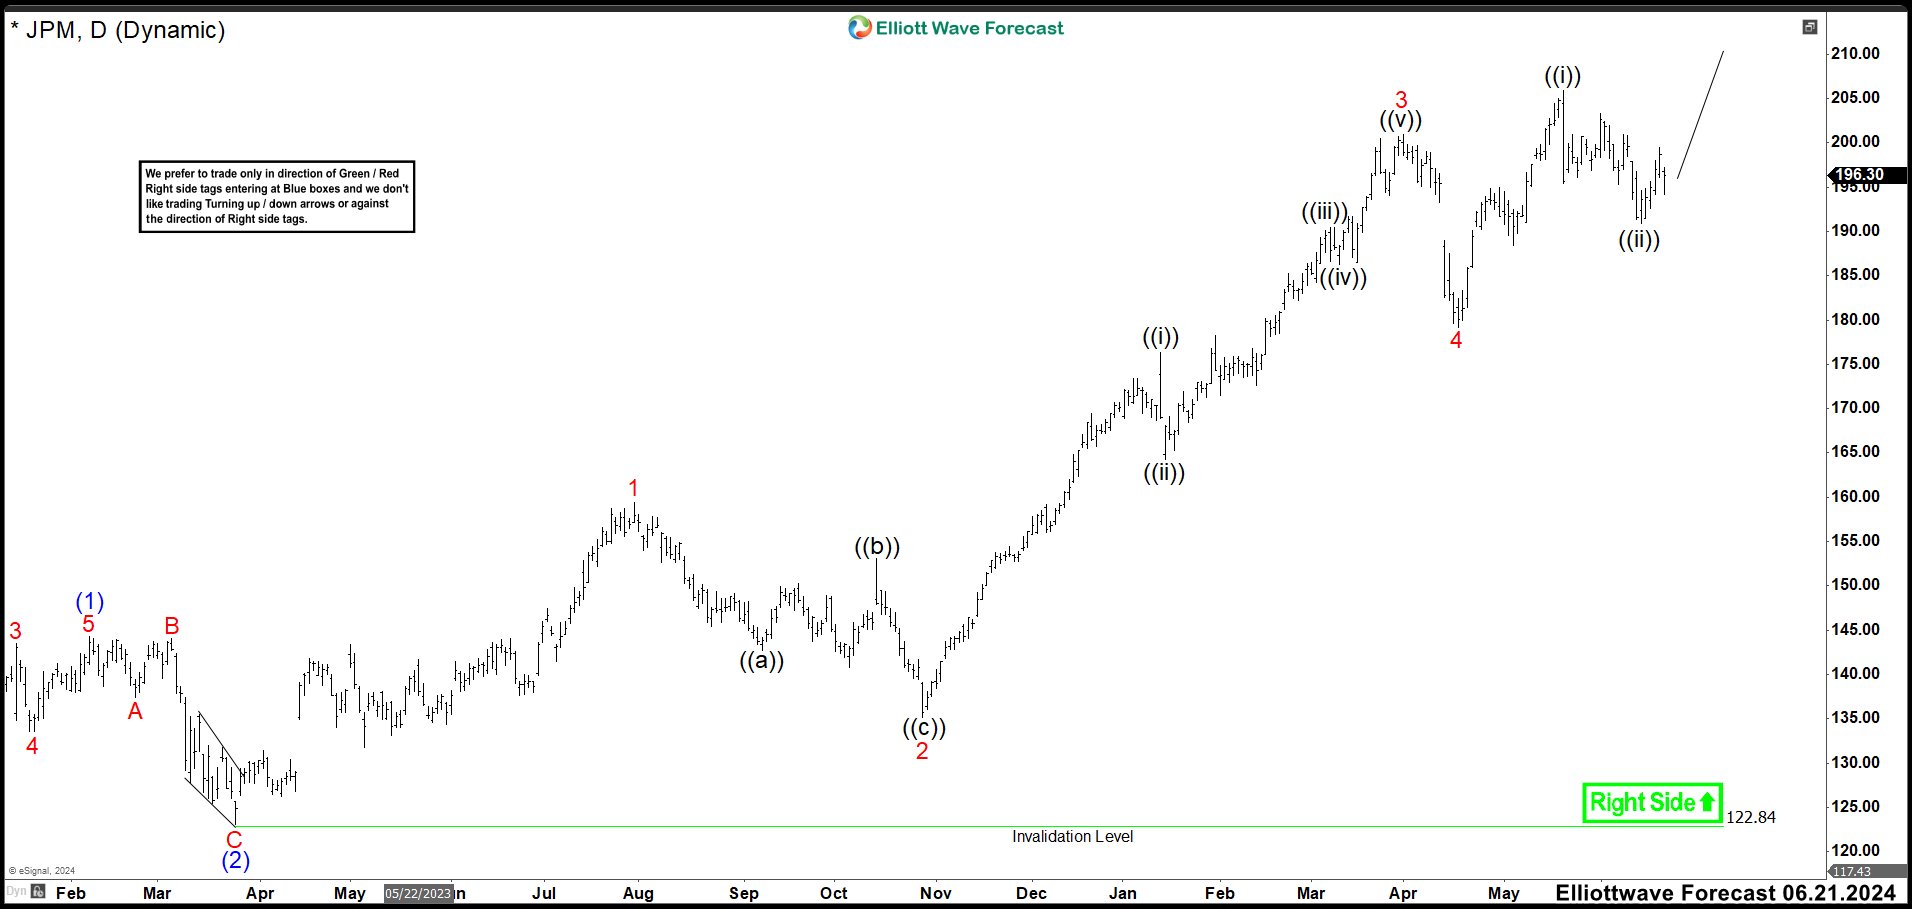
JPM Daily Chart June 2024
More than a year ago, we have see how JPMorgan shares have double in value from 100 to 200 dollars. Above we have the Daily Chart Forecast from June. We were expecting to continue higher to end a wave (3) structure. We called wave (1) at 144.34 high. Then a flat correction as wave (2) finished at 123.11 low, and the rally should end a wave 5 of (3) in 206 – 215 area before seeing a pullback in wave (4).
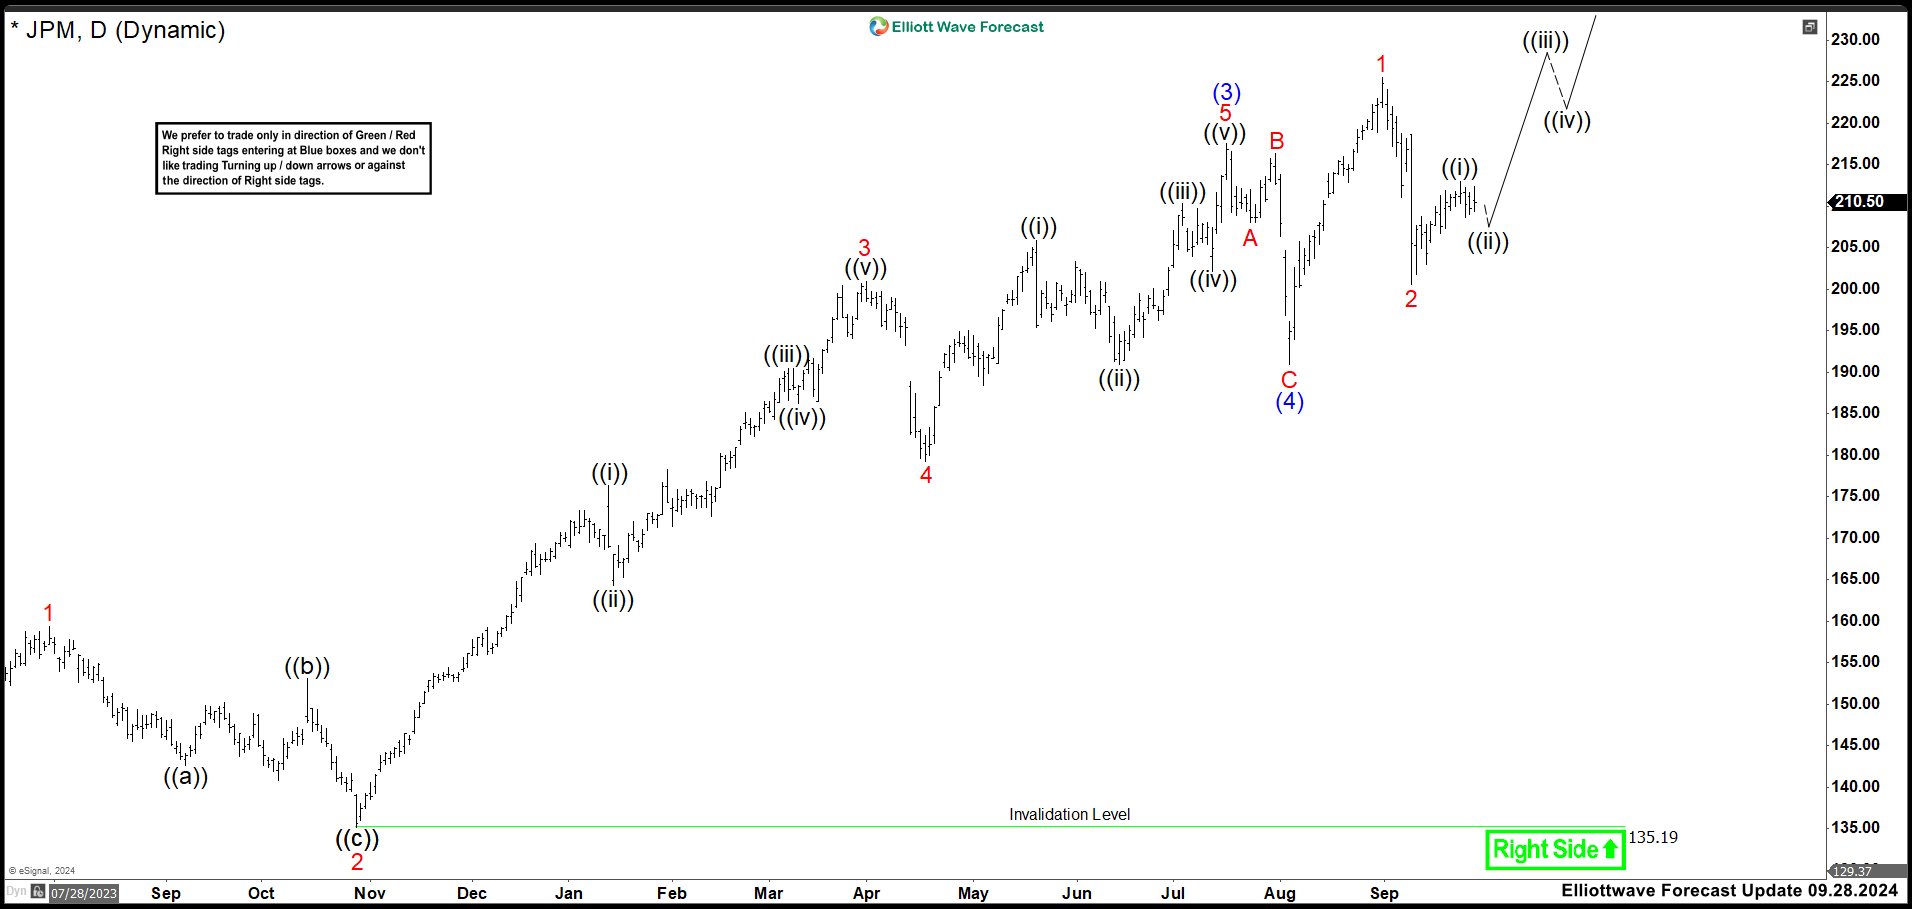
JPM Daily Chart September 2024
After some days, JPM completed wave (3) as expected forming a new high for July. At the end the impulse was like this: wave 1 ended at 159.38 high. Then market did a zig zag correction to end wave 2 at 135.19 low. The stock did a strong rally to 200.94 to end wave 3 and the correction as wave 4 ended at 179.20 low. Last push to complete wave (3) reached 217.56 high, a little more than the area we are expecting for. Wave (4) was very fast, developing a flat structure ending at 190.92 low. The market rally again and it is building wave (5) of ((3)). Currently, wave 1 of (5) ended at 225.48 and wave 2 of (5) completed at 200.61. Actually, we are looking for more upside to end wave 3 of (5).
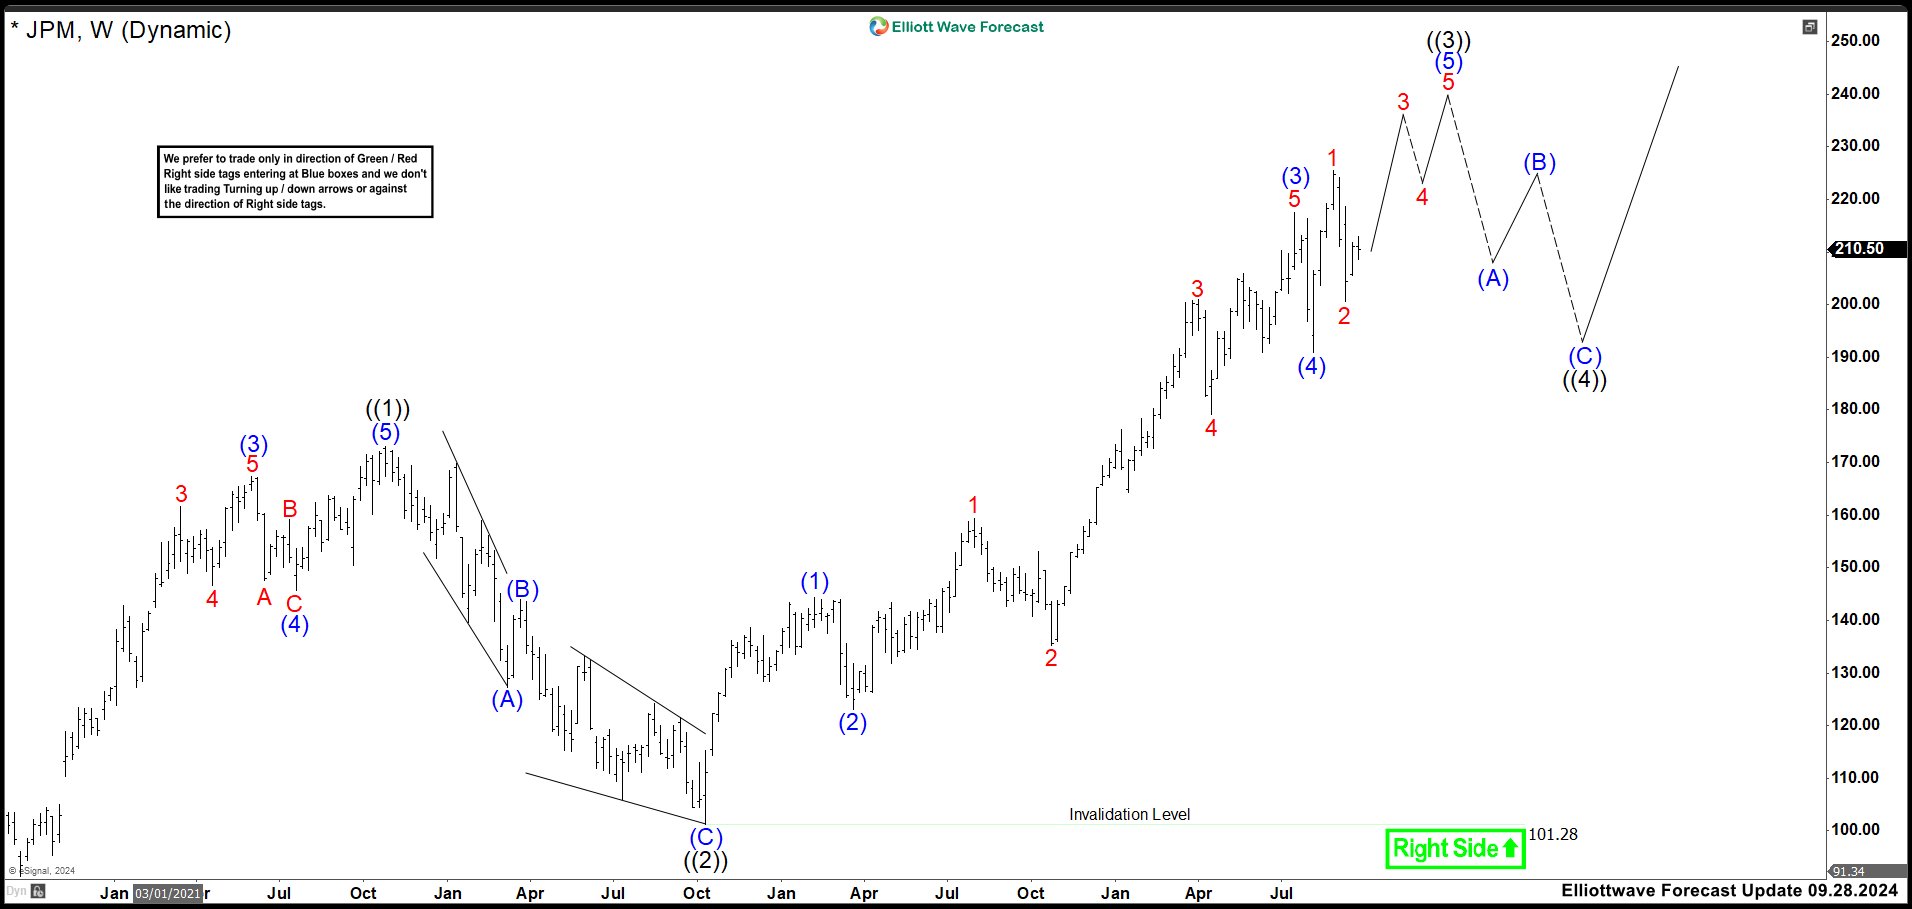
JPM Weekly Chart September 2024
In the weekly chart, we can see the complete impulse from March 2020 low. Wave ((1)) ended at 172.28 and wave ((2)) completed at 101.28 low. The impulse from 101.28 low is still incomplete and it needs more upside to end wave ((3)). The ideal area to end this wave ((3)) comes in 234 – 241 zone, if there is not more extension, where sellers should be waiting to start wave ((4)) correction.
Elliott Wave Forecast
www.elliottwave-forecast.com updates one-hour charts 4 times a day and 4-hour charts once a day for all our 78 instruments. We do a daily live session where we guide our clients on the right side of the market. In addition, we have a 24 hours chat room where we will help you with any questions about the market.
14 day Trial costs $9.99 only. Cancel anytime at support@elliottwave-forecast.com
Back


