John Deere is an American corporation that manufactures acricultural, construction and forestry machinery, diesel engines and drivertrains. Founded in 1837 and based in Moline, Illinois, USA, the stock being a component of the S&P500 index can be traded under ticker $DE at NYSE. Currently, we can see agriculture commodities like wheat and corn on the one side and lumber prices on the another side strongly rallying. Hereby, John Deere being an important player in the manufacturing of machinery for those markets should be a great opportunity for investors to diversify their portfolio by indirect participation in the rising commodity prices.
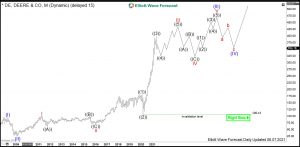
Deere Monthly Elliott Wave Analysis 06.13.2021
The Monthly chart below shows the John Deere shares $DE traded at NYSE. From the all-time lows, the stock price has developed a series of nests. First, the cycle in blue (I) ended on April 2008 and the pullback made a bottom on March 2009. Then, from the 24.51 lows, a cycle higher within red I of blue (III) reached towards 99.80 highs. That cycle saw later a retracement in wave II towards 70.16 lows in January 2016. Finally, another nest has been formed by waves ((1))-((2)). From the March 2020 lows at 106.14, a powerful acceleration within black wave ((3)) of red wave III of blue (III) has taken place. Deere saw the all-time highs in May 2021 at 400.34.
Now, investors and traders should be expecting John Deere drifting higher in series of waves 4 and 5. Upcoming 5th waves should resolve the previously seen nests. Therefore, one can be looking to buy the pullbacks in 3, 7, or 11 swings against 106.14 lows for a rally towards the new all-time highs.
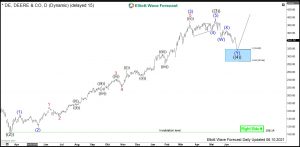
Deere Daily Elliott Wave Analysis 06.13.2021
The daily chart below shows the advance higher in black wave ((3)). It is a clear impulsive move with extension. Now, the pullback in wave ((4)) is unfolding as a double correction. Waves (W)-(X) have finished, wave (Y) can reach lower towards 318.89-287.66 area. Therefore, investors and traders can be looking to buy the wave ((4)) pullback from that area if reached. Then, expect a rally in wave ((5)) to the new all-time highs. Alternatively, a bounce in 3 waves as minimum should take place.
Get more insights about Stocks and ETFs by trying out our services 14 days . You’ll learn how to trade the market in the right side using the 3, 7 or 11 swings sequence. You will get access to our 78 instruments updated in 4 different time frames, Live Trading & Analysis Session done by our Expert Analysts every day, 24-hour chat room support and much more.
Back


