IONQ inc. is a pioneer in the development and manufacturing of quantum computers, focusing on quantum computing and quantum information processing. Founded in 2015 by Christopher Monroe and Jung Sang Kim, the company is headquartered in College Park, MD.
This blog post provides an in-depth technical analysis of IONQ’s stock performance, specifically its weekly chart. Key findings include:
-
Two upward channels emerging from all-time lows
-
A potential nest structure forming, indicating further upside potential for the IONQ ticker symbol.
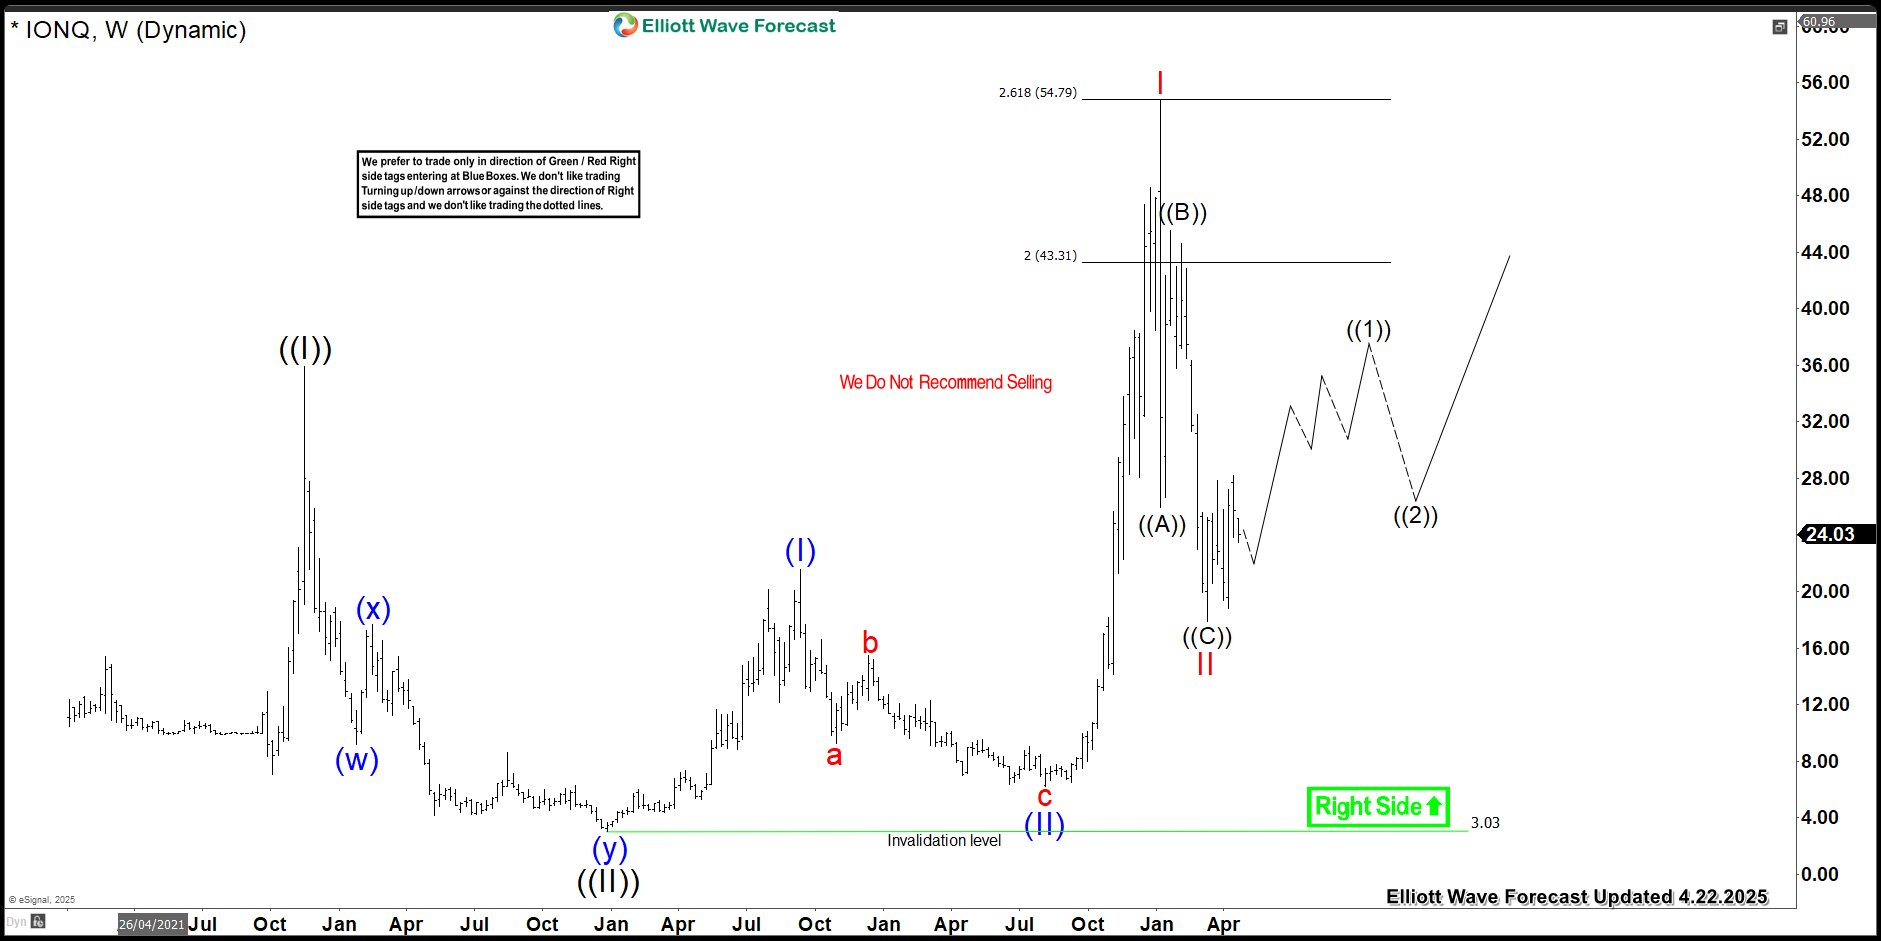
In which the rally to $35.90 high ended wave ((I)) and down from there made a pullback lower. The internals of that pullback unfolded as a double three structure where wave (w) ended at $9.16 low. Then a bounce to $17.66 high ended wave (x) bounce. And wave (y) ended at $3.03 low, thus completed wave ((II)) pullback. Up from there, the stock is nesting higher in an impulse sequence where wave (I) ended at $21.60 high. Wave (II) pullback ended at $6.22 low and made a very nice rally higher. Since then the stock rallied in wave I at $54.74 high and made a 3 wave pullback in wave II. The internals of that pullback unfolded as zigzag correction where wave ((A)) ended at $25.92 low. Wave ((B)) bounce ended at $45.56 high and wave ((C)) ended at $17.88 low. Near-term, as far as dips remain above $17.88 low expect stock to resume the upside.
IONQ Elliott Wave Weekly Analysis From 4.22.2025
If you are looking for real-time analysis in Stocks & ETFs then join us with a 14-Day Trial for the latest updates & price action.
Success in trading requires proper risk and money management as well as an understanding of Elliott Wave theory, cycle analysis, and correlation. We have developed a very good trading strategy that defines the entry.
Stop loss and take profit levels with high accuracy and allow you to take a risk-free position, shortly after taking it by protecting your wallet. If you want to learn all about it and become a professional trader. Then join our service by taking a Trial.
Back

