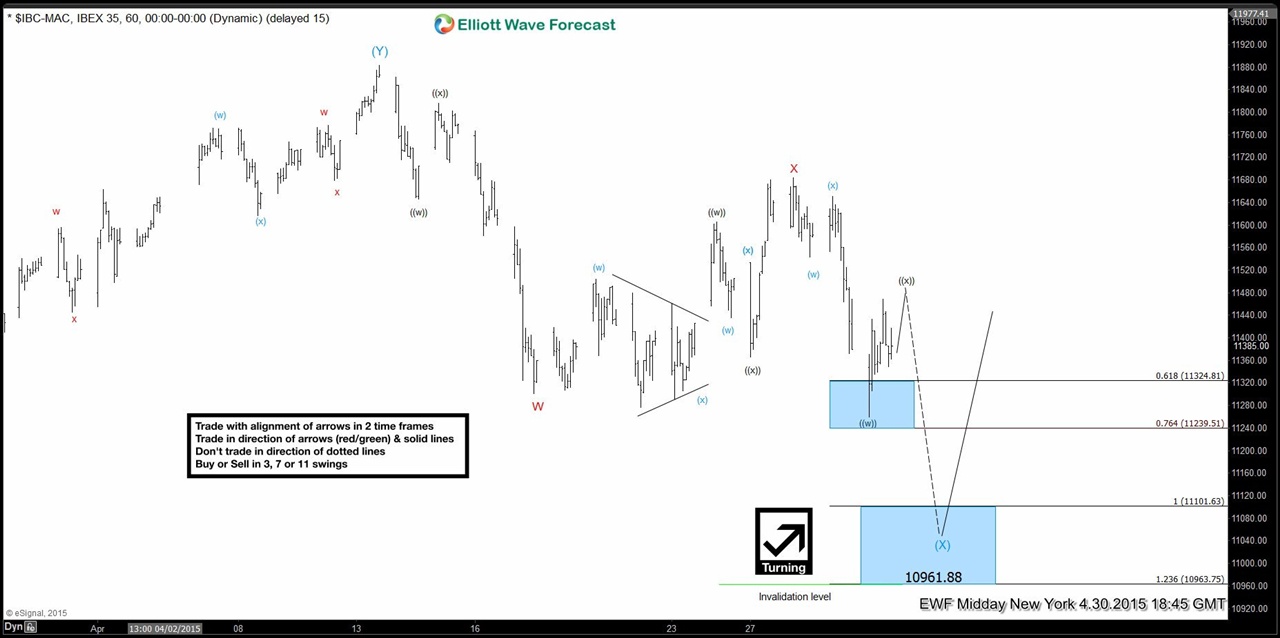
Short term Elliott Wave view suggests rally to 11883.6 completed wave (Y). Decline from here is taking the form of a double three or WXY structure when wave W ended at 11301, wave X ended at 11684.3, and wave Y lower is in progress. Wave ((w)) of Y ended at 11259.1, wave ((x)) of Y bounce is currently in progress and could retrace 50 – 61.8% (11471.7 – 11521.87) of the move lower from 11684.3. As the proposed wave ((x)) bounce holds below 11684.3 high, expect the Index to continue lower towards 10963.75 – 11101.63 area before it turns higher. As the decline lower is represented with a dashed line, we don’t like selling the Index and expect the Index to find buyers in 10963.75 – 11101.63 (equal leg – 1.236 extension area) for a 3 waves higher at minimum as per Elliott Wave hedging idea.
If you would like to know more about how we can help you, I invite you to join our 14 day Trial. For limited time, we are now offering free 14 days trial and you can check all our services. We offer 24 hour coverage of 41 instruments from Monday – Friday using Elliott Wave Theory as primary tools of analysis. We provide Elliott Wave chart in 4 different time frames, up to 4 times a day update in 1 hour chart, two live sessions by our expert analysts, 24 hour chat room moderated by our expert analysts, market overview, and much more! With our expert team at your side to provide you with all the timely and accurate analysis, you will never be left in the dark and you can concentrate more on the actual trading and making profits.
Back

