Houston American Energy Corporation stock enjoyed the impulsive rally the rest of the sector had in early 2022. After the pullback, can the rally continue? Lets take a look at their company profile:
“Houston American Energy Corp is an oil and gas exploration and production company. Our oil and gas exploration and production activities are focused on properties in the U.S. onshore Gulf Coast Region. Principally Texas and Louisiana, and on the development of concessions in the South American country of Colombia. We seek to utilize the contacts, experience, financial acumen and expertise in oil and gas geology, engineering and production provided by our management and Board of Directors to seek out and evaluate favorable drilling opportunities.
We generally seek to form partnerships and joint ventures to spread the cost and risks to us of drilling while maximizing our potential returns. The company’s fiscal discipline and debt-free capital structure offers investors a great deal of leverage and upside potential as revenue from new projects is realized.”
This is a highly speculative energy producer, lets take a look at the charts!
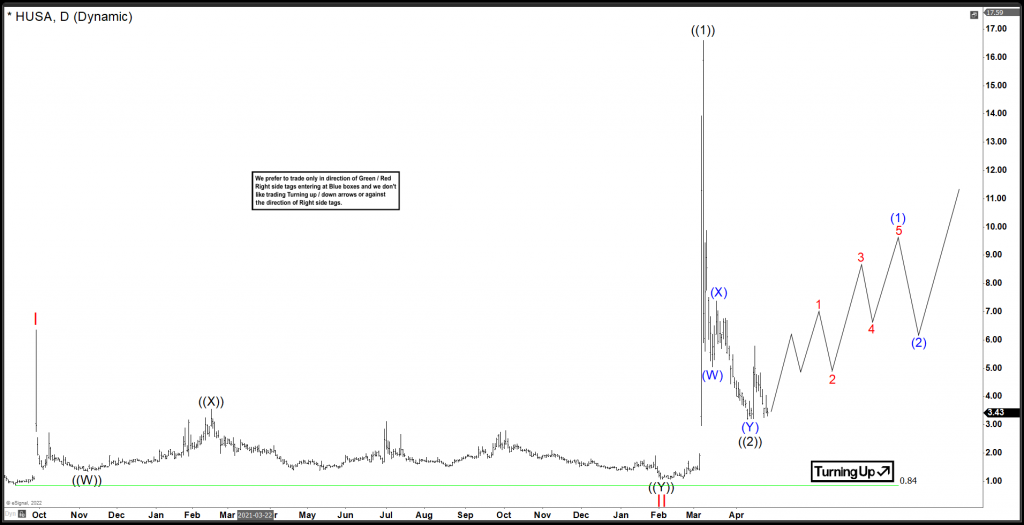
Houston American Energy Elliottwave Daily View:
Longer term view from the low set in September 2020 @ 0.84. After that, there was a large impulse into the peak at Red I at a peak of 6.36. Consequently, a very long and drawn out correction has taken place. After that, this correction ended on Feb 3 2022 @ a low of 1.09 in Red II. After that another very impulsive reaction took place to the upside again, which is favouring to have formed a nest in ((1)). Lets zoom into the 4H view.
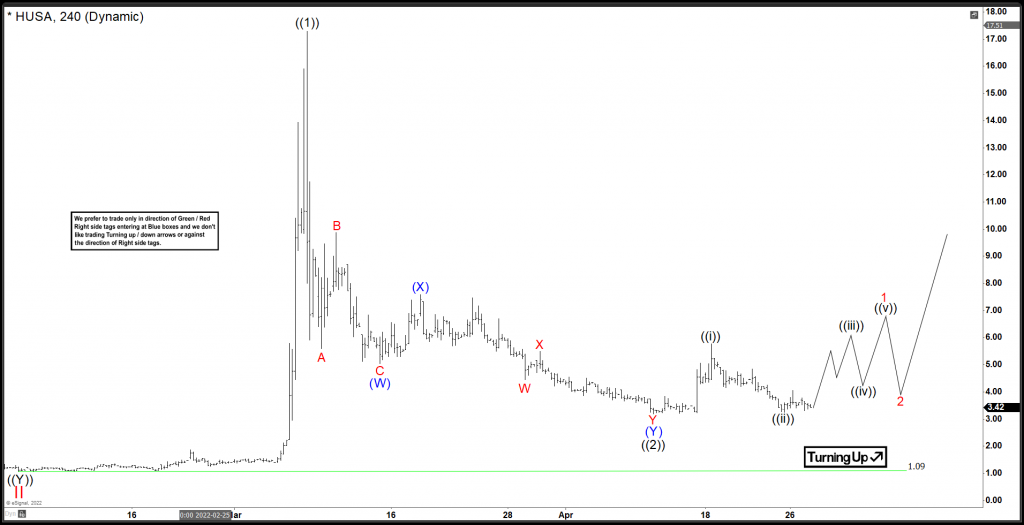
Houston American Energy Elliottwave 4H View:
Medium term term view from the low set Feb 2022 @ $1.09. After that, a large impulse has taken place in ((1)) which peaked on March 8/2022 at a high of 17.30. Consequently, a pullback has taken place to correct the cycle from the Feb 2022 low. It has unfolded as a double 3 correction. ((2)) is currently set on April 11 2022 low @ 3.19. In conclusion, this low needs to hold in order for this view to remain intact, or more grinding lower may take place before ((2)) is set.
Risk Management
Using proper risk management is absolutely essential when trading or investing in a volatile stocks. Consequently, Elliott Wave counts can evolve quickly, be sure to have your stops in and define your risk when trading.
Improve your trading success and master Elliott Wave like a pro with our 14 day trial today. Get Elliott Wave Analysis on over 70 instruments including GOOGL, TSLA, AAPL, FB, MSFT, GDX and many many more.
Back


