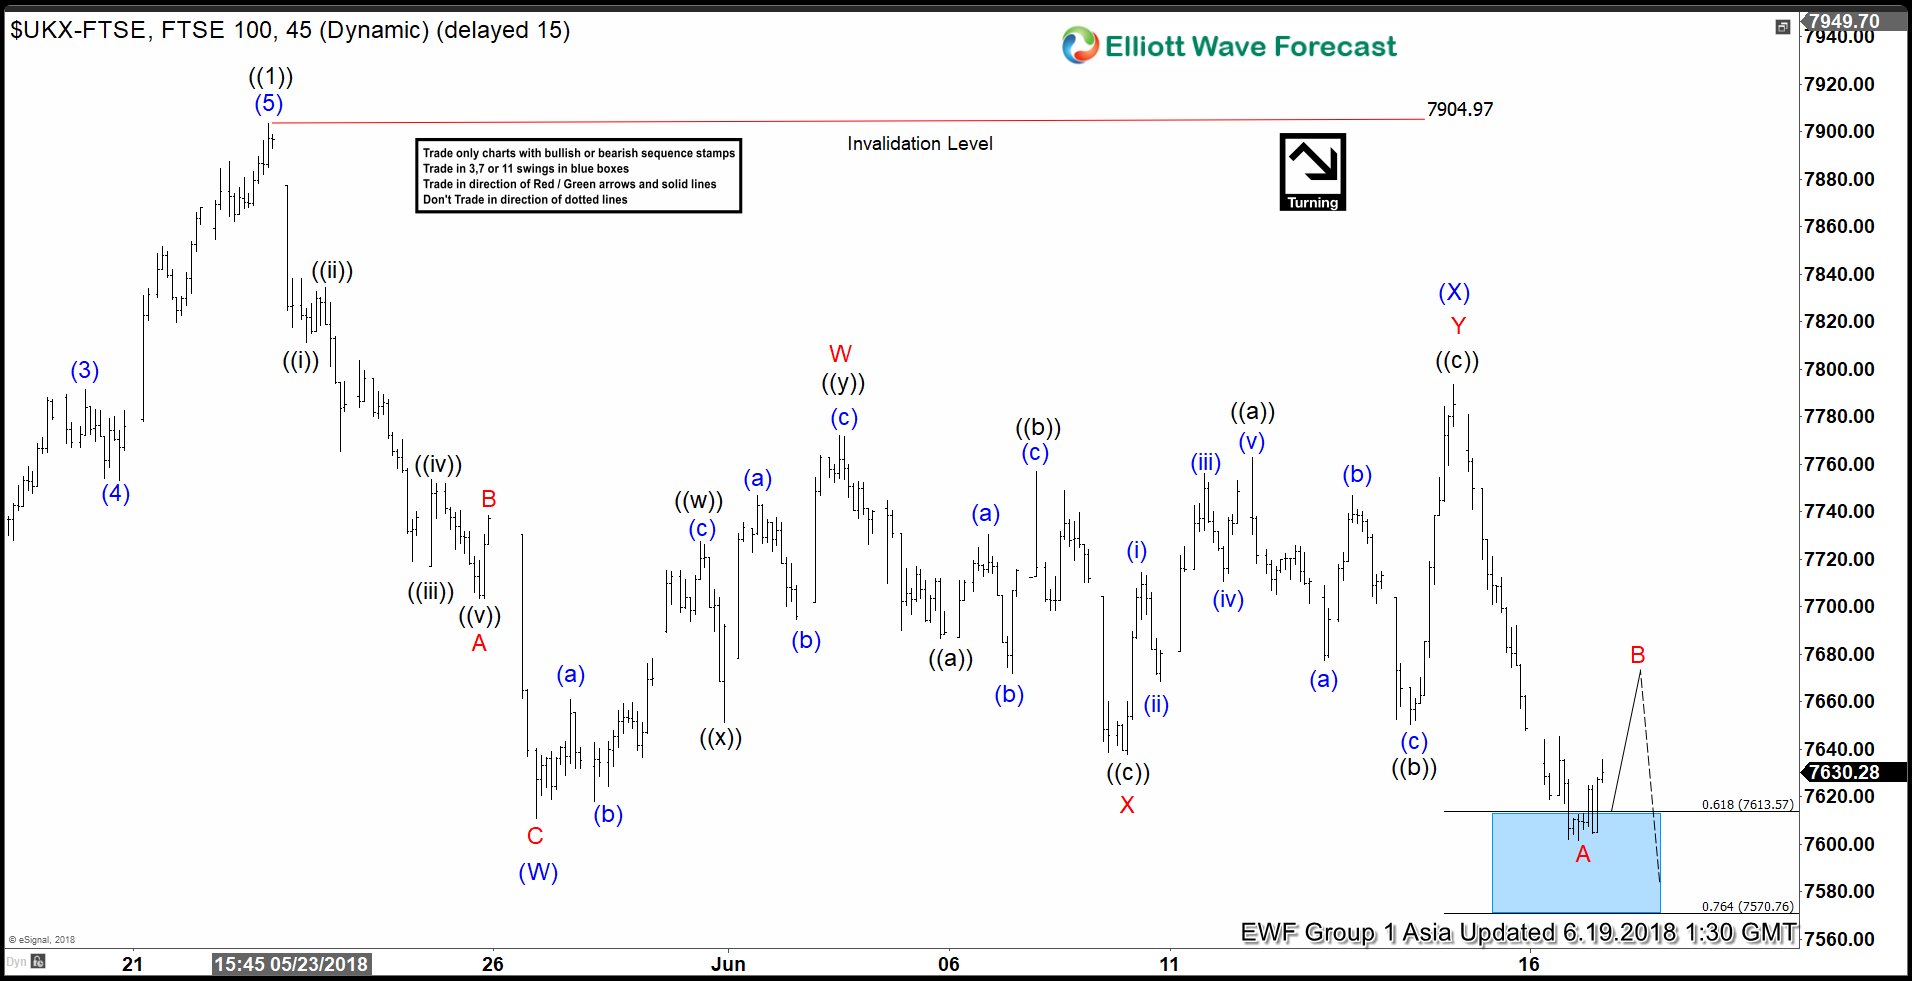
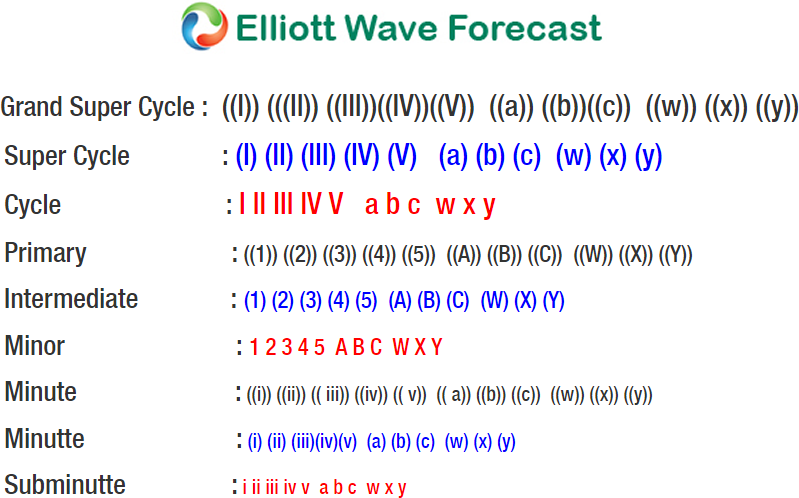
FTSE short-term Elliott Wave view suggests that the bounce to 7904.97 high on 5/22/2018 peak ended primary wave ((1)). Below from there, the index is doing a pullback in Primary wave ((2)) in 3, 7 or 11 swings to correct cycle from 3/23/2018 low. Down from 7904.97 high, the decline to 7610.66 low ended the first leg of the pullback in Intermediate wave (W). The internals of Intermediate wave (W) unfolded as Elliott wave Zigzag structure where Minor wave A ended at 7703.26, Minor wave B ended at 7738.46, and Minor wave C of (W) ended at 7610.66. Up from there, the bounce to 7793.45 high ended the correction against 5/22/2018 cycle in Intermediate wave (X). The internals of Intermediate wave (X) unfolded as double three structure where Minor wave W ended at 7772.12, Minor wave X ended at 7637.52 and Minor wave Y of (X) ended at 7793.45.
Then down from there, the index has made a new low below Intermediate wave (W) at 7610.66 low confirming the next leg lower within intermediate wave (Y) of ((2)) has started. Near-term, while below 7793.45 high, the rally is expected to fail in 3, 7 or 11 swings for another leg lower towards 7435.72 – 7504.01, which is 100%-123.6% Fibonacci extension area of Intermediate wave (W)-(X) to complete Primary wave ((2)). Afterwards, the index is expected to find buyer’s either for a new high or for 3 wave bounce at least. We don’t like selling it in the proposed pullback.


