Fresnillo plc is the world largest silver producer which has its headquarters in Mexico City. Founded 2008, incorporated in UK and traded under tickers $FRES at LSE and $FNLPF in US in form of ADRs, it is a component of the FTSE100 index. Besides its dominating role in silver, Fresnillo plc is also the second largest gold miner of Mexico. Currently, silver is turning up from the march 2020 lows. Therefore, an investment in shares of a silver producing company can provide an exposure to the prices of that precious metal. Hereby, Fresnillo plc as a market leader should become an excellent investment candidate.
Fresnillo Monthly Elliott Wave Analysis 08.06.2020
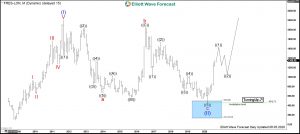
The monthly chart below shows the Fresnillo stock $FRES at LSE. From the November 2008 lows at 93, the stock price has developed a cycle higher in wave (I) of a super cycle degree. Fresnillo has printed a top on September 2011 at 2213. The cycle up is an impulse; it shows 5 subwaves of a cycle degree and a separation within the wave III.
From the 2011 highs at 2213, a correction lower has unfolded as a zigzag correction being a 5-3-5 structure. Red waves a and c are showing a regular umpulse, the connector in wave b is an expanded flat structure. The wave c has reached an equality with the wave a at the equal legs extension area towards 494.98-134.93. As a consequence, price shows a reaction higher from that zone. The strong advance confirms the end of the wave c of the blue wave (II). Also, the larger correction in wave (II) as a whole has highly probably ended. Therefore, while above 454.71, the price can extend higher within wave (III) towards 2213 and higher or should do a 3 waves bounce at least.
Fresnillo Monthly Elliott Wave Analysis 08.06.2020
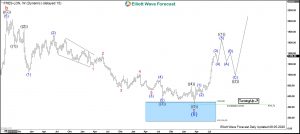
The weekly chart below shows in more detail the last leg lower in wave c of blue wave (II) and the sharp advance out of the equal legs extension area being 494.98-134.93. The push up from the March 2020 lows can be seen so far as a 3 waves move. However, wave (3) has already surpassed the 1.618 multiple extension of the wave (1). Therefore, after a pullback in wave (4), expect another leg higher in wave (5) to end the black wave ((1)).
Investors and traders can obtain a good opportunity to enter the rally in $FRES at a pullback. Medium-term, a correction lower in wave ((2)) should find support above the March lows at 454.71 in 3, 7 or 11 swings. Then, an extension higher in wave ((3)) to new highs should follow or $FRES should produce another leg higher at least. As an outlook, montly target for the wave (III) is 2572-3885. Break of the 2213 level would confirm that the wave (III) is underway.
Get more insights about Stocks and ETFs by trying out our services 14 days . You’ll learn how to trade the market in the right side using the 3, 7 or 11 swings sequence. You will get access to our 78 instruments updated in 4 different time frames, Live Trading & Analysis Session done by our Expert Analysts every day, 24-hour chat room support and much more.
Back


