Another sector that has really taken off since the March low is Solar Energy. The ETF $TAN is up an astonishing 266% since the March low. This sector is hot, and trying to find value in a sector that has already had an explosive move is tough to do. Enter First Solar Inc.
It has a chart that is nesting 1s and 2s for what is likely to be a breathtaking breakout once the multi year breakout occurs. Lets take a look at the company profile:
“First Solar, Inc. is an American manufacturer of solar panels, and a provider of utility-scale PV power plants and supporting services that include finance, construction, maintenance and end-of-life panel recycling. First Solar uses rigid thin film modules for its solar panels, and produces CdTe-panels using cadmium telluride (CdTe) as a semiconductor. In 2009, First Solar became the first solar panel manufacturing company to lower its manufacturing cost to $1 per watt.
The company was founded in 1990 by inventor Harold McMaster as Solar Cells, Inc. and the Florida Corporation in 1993 with JD Polk. In 1999 it was purchased by True North Partners, LLC, who rebranded it as First Solar, Inc. The company went public in 2006, trading on the NASDAQ. Its current chief executive is Mark Widmar, who succeeded the previous CEO James Hughes July 1, 2016. First Solar is based in Tempe, Arizona.
As of 2010, First Solar was considered the second-largest maker of PV modules worldwide. and ranked sixth in Fast Company’s list of the world’s 50 most innovative companies. In 2011, it ranked first on Forbes’s list of America’s 25 fastest-growing technology companies. It is listed on the Photovoltaik Global 30 Index since the beginning of this stock index in 2009. The company was also listed as No. 1 in Solar Power World magazine’s 2012 and 2013 rankings of solar contractors”
Lets dig into the charts!
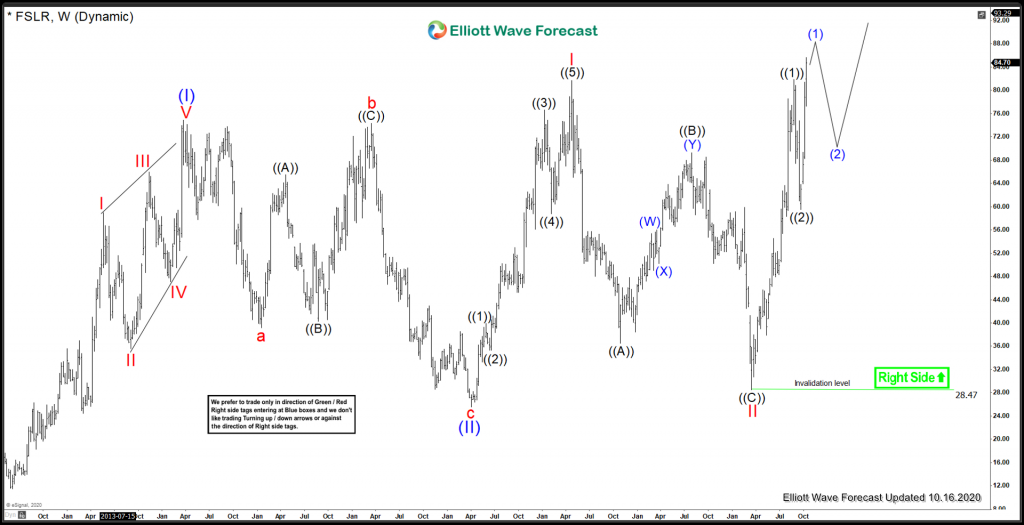
First Solar Elliott Wave Weekly View:
On a Weekly Time Frame. From the 2012 lows of 11.43, First Solar has been working on a very bullish structure. with Blue (I) peaked in March 2014 at 74.84, and Blue (II) bottomed in April 2017 at 25.56. After that, First Solar rallied into a nesting Red I which peaked in April 2018, at 81.72. From there, a Red II is favoured set March 2020 at a low of 28.47. Prices have already made new swing highs above Red I creating a bullish sequence. Black ((1)) and ((2)) are favoured to be set, and another nest is favoured to take place before further upside in a wave (III) breakout takes place.
Lets zoom into the 4H view.
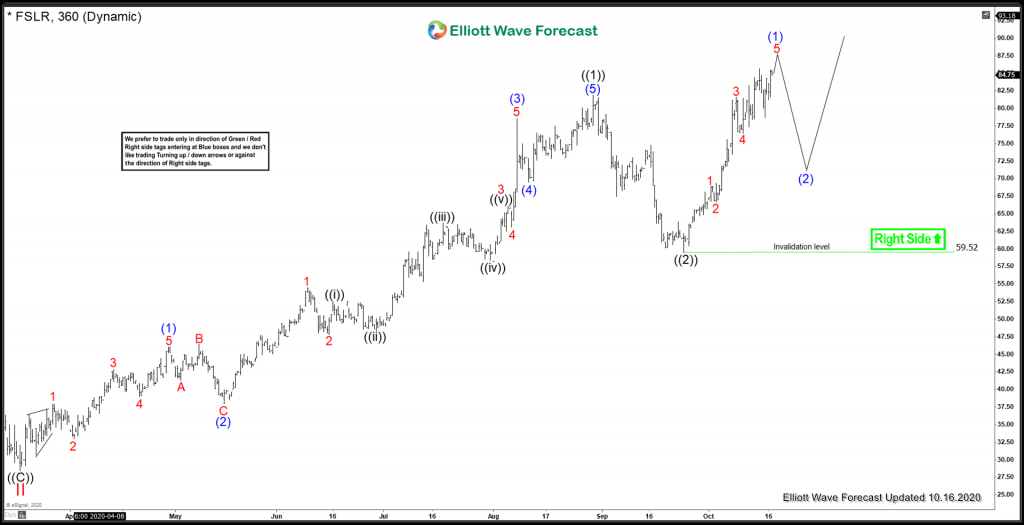
First Solar 4H Elliott Wave View:
Medium term term view from 3/16/2020 lows of 28.47. There is a 5 waves impulse leading into black ((1)) which peaked on August 28/2020 at a price of 81.87. After that a black ((2)) is favoured set on September 24/2020 at 52.52. Presently, I am favouring some more upside in blue (1) before correcting the cycle from the September 24 low. As long as prices remain above 59.52, I favour further upside to take place.
In conclusion, the structure from the 2012 low on First Solar is very bullish. It has potential to break out in a multi year rally. I do not like selling/shorting this name, and as long as prices remain above 52.52, further upside is expected to take place.
Risk Management
Using proper risk management is absolutely essential when trading or investing in a volatile stocks. Elliott Wave counts can evolve quickly, be sure to have your stops in and define your risk when trading.
Improve your trading success and master Elliott Wave like a pro with our free 14 day trial today.
Back


