Marathon Oil Corporation (MRO) is the industry from Energy sector working as independent Oil & Gas Exploration & Production. It is headquartered in Houston, Texas & trades under MRO ticker at NYSE.
This is a continuation article for Elliott Wave view, previously posted on 10/17/2021. In previous article, we expect it to extend higher in the cycle started from August low in shorter time frame.
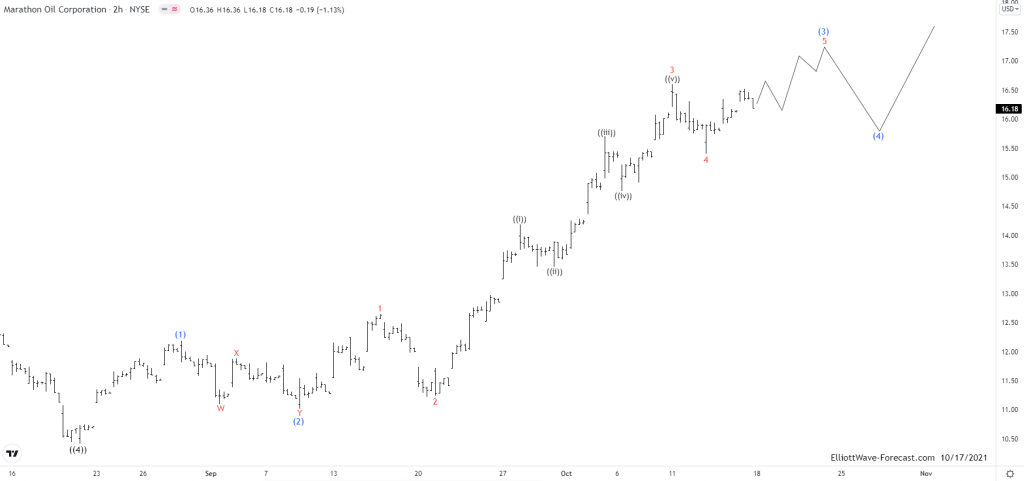
MRO – Old Elliott Wave analysis – 2 hour chart from 10/17/2021:
MRO made all time low Since 1969 during Covid pandemic sell off at $3.02 low on 4/01/2020. Thereafter it started higher high sequence & already made 17 swings higher from major low. Until the dips remains above 8/20/2021 low, it expect to extend higher in impulse sequence. Previously, MRO was analyzed in 2-hour chart, on 10/17/2021. It was expected to make at least two more highs to end the sequence started from $10.42 low on 8/20/2021. It was outperforming the Energy sector from August low. In 2-hour, it was ended 3 red at $16.60 & 4 at 15.40 low. While above there it was expected to reach $17.40 level as possible extension higher before it starts any larger pullback against August-2021 cycle.

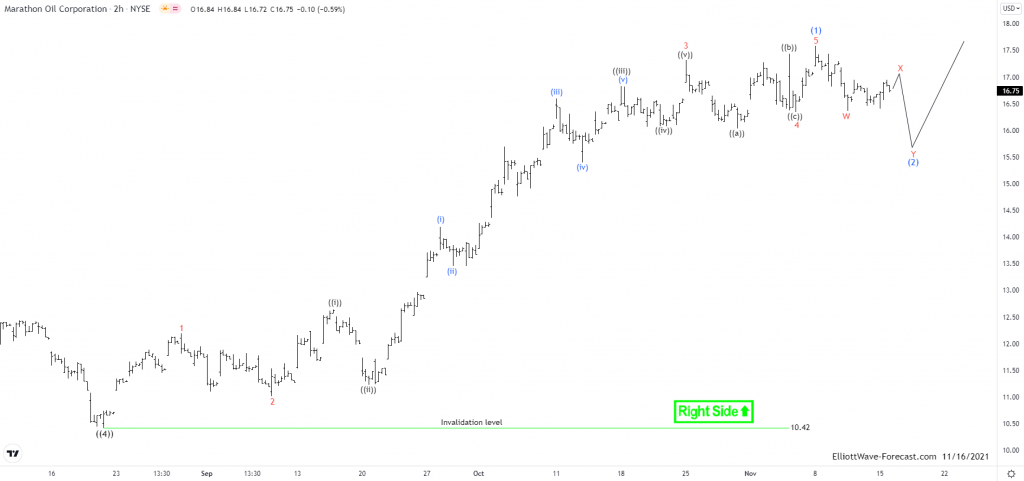
MRO – Current Elliott Wave View – 2 hour chart:
It unfolds as expected as in previous update. It favored ended (1) at $17.58 high on 11/08/2021 as impulse sequence started from 8/20/2021 low. Within the sequence, 1 red ended at $12.19 high, while below there 2 ended at $11.02 low. The wave 3 favored ended at $17.32 high as third wave extension in third wave extension as 9 swings. The wave 4 ended at $16.34 low as running flat correction. Finally, the 5 ended at $17.58 high. Currently it favors the correction against the August-2021 low in proposed W-X-Y correction as (2) before it resumes the next leg higher or at least 3 swing bounce. Alternatively, it can do double correction lower in (2), if the bounce fails below $17.58 high. We like to stay long when it reaches the equal leg area within the correction lower against the August low.

Elliottwave Forecast updates 1-hour charts four times a day & 4-hour charts once a day for all our 78 instruments. We do a daily live session where we guide our clients on the right side of the market. In addition, we have a chat room where our moderators will help you with any questions you have about what is happening in the market at the moment. You can try us for 14 days for only $9.99.
Back
