Centennial Resource Development, Inc. ( CDEV ), is an independent Oil & Natural gas company from Energy Sector, focuses on the development of unconventional oil & associated liquid rich natural gas reserves in US. It trades under CDEV ticker at Nasdaq.
CDEV – Elliott Wave View on Daily chart:
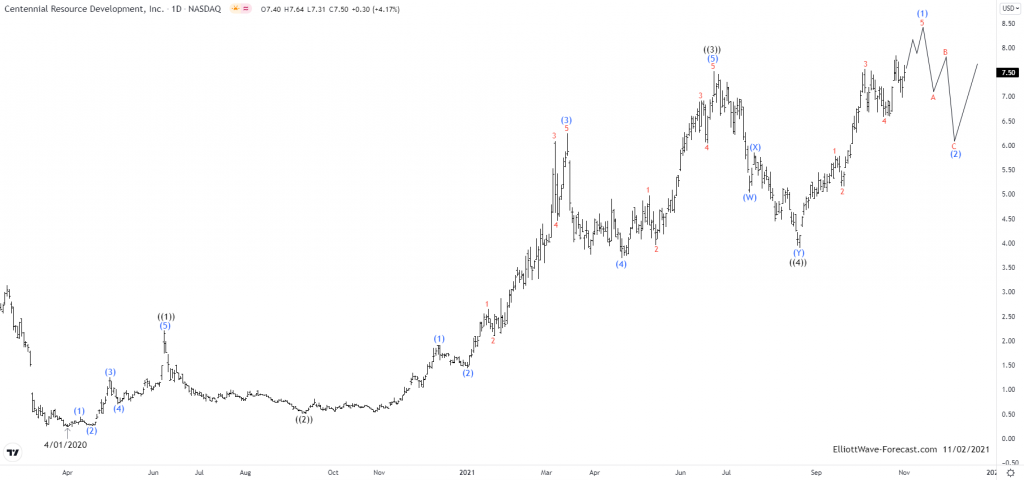
Since 2016, CDEV made all time low at $0.24 in April-2020 during the global sell off in early last year. Thereafter it started higher high sequence as an impulse & favors ((5))th wave up.
It started the impulse sequence as ((1)) from April-2020 low & ended at $2.21 high on 6/08/2020. The ((2)) was quite dip correction as 0.854 retracement against previous cycle & ended at $0.51 low on 9/10/2020. Thereafter it started ((3)) as extended move & favored ended at $7.52 high on 6/23/2021. While below there it placed ((4)) at $3.90 low on 8/20/2021. Thereafter it extends higher as the part of ((5)) up. It confirmed the higher high sequence by breaking above the previous high of ((3)). It suggest the next extension higher in progress as (1) expecting one more high before it starts pulling back in (2). As far as the dips remains above $3.90 it expects to extend higher in ((5)).
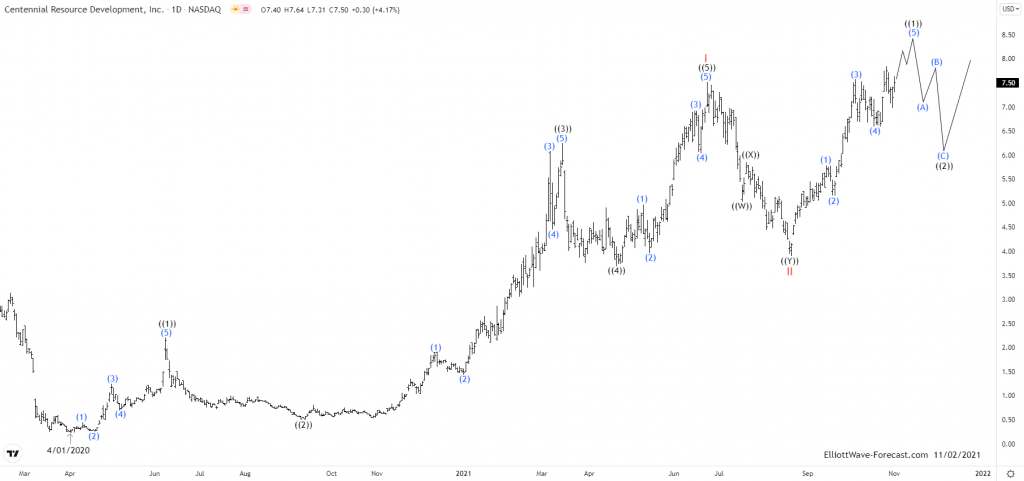
Alternatively, it has finished the impulse as I red at June-2021 peak & the correction as II at August-2021 low & until dips remains above August low, it expect to extend higher as the part of III as shown in alternate view below. So both the views suggest that pullback should be supported and extend higher.
Elliottwave Forecast updates 1-hour charts four times a day & 4-hour charts once a day for all our 78 instruments. We do a daily live session where we guide our clients on the right side of the market. In addition, we have a chat room where our moderators will help you with any questions you have about what is happening in the market at the moment. Let’s trial 14 days for only $9.99 here: I want 14 days trial.
Back


