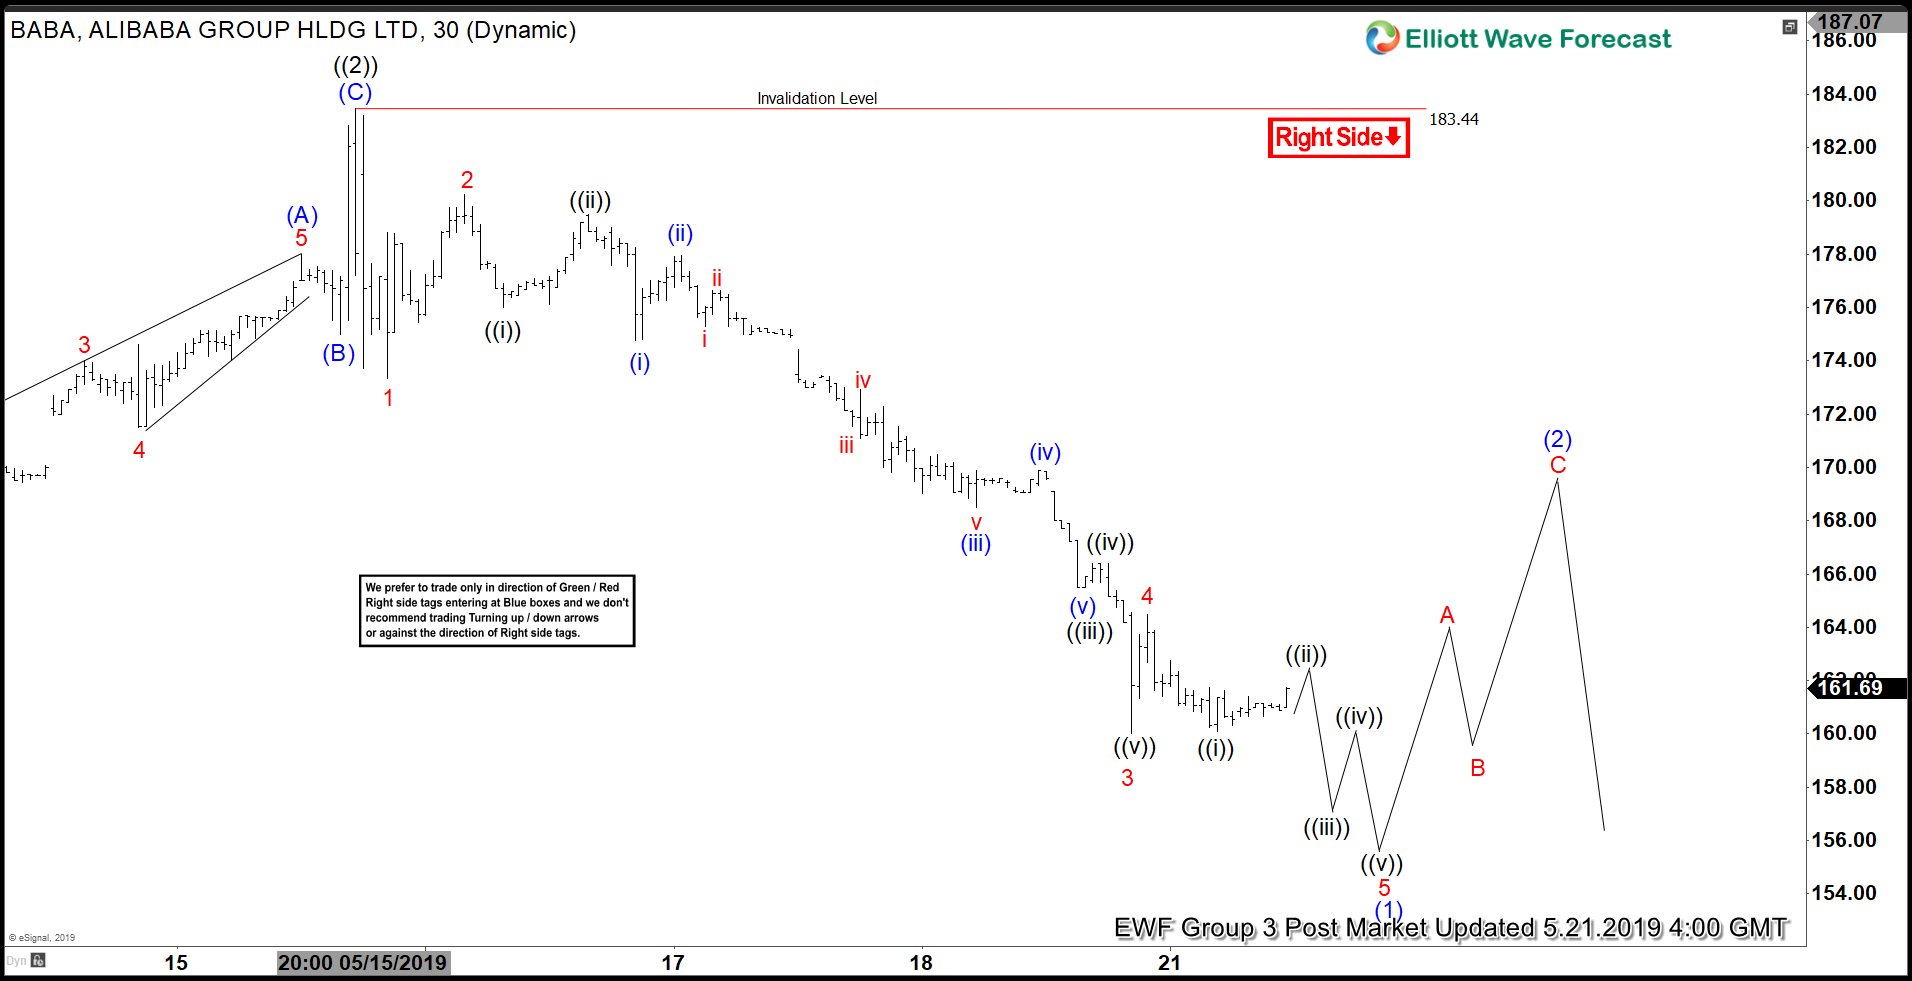
Short term Elliott Wave view in Alibaba (BABA) shows an incomplete sequence from May 4, 2019 peak. The decline from there can either unfold as a zigzag or impulsive Elliott Wave structure. We use the impulsive structure as the chart below shows that the rally to $183.44 ended wave ((2)). This means, Alibaba is now within wave ((3)) lower. In Elliott Wave Theory, wave ((3)) is typically the strongest and longest wave in impulse structure.
Wave ((3)) is currently in progress as an impulse Elliott Wave structure where the stock is ending wave (1) of ((3)). Down from $183.44, wave 1 ended at $173.32, wave 2 ended at $180.24, wave 3 ended at $160.02, and wave 4 ended at $164.50. Another leg lower should end wave 5 of (1). The stock should then bounce in wave (2) to correct cycle from May 15, 2019 high before the decline resumes. We don’t like buying the stock and expect any rally to fail in 3, 7, or 11 swing for further downside as far as bounce stays below $183.44. A conservative target where the 3 swing from May 4, 2019 peak reaches equality comes at $149.7 – $156.2.

