Hello Everyone! In this technical blog, we are going to take a look at the Elliott Wave path in Real Estate ETF ($IYR).
The iShares U.S. Real Estate ETF seeks to track the investment results of the $DJUSRE index. The index is composed of U.S. equities in the real estate sector. It provides exposure to U.S. real estate companies and REITs, which invest in real estate directly and trade like stocks.
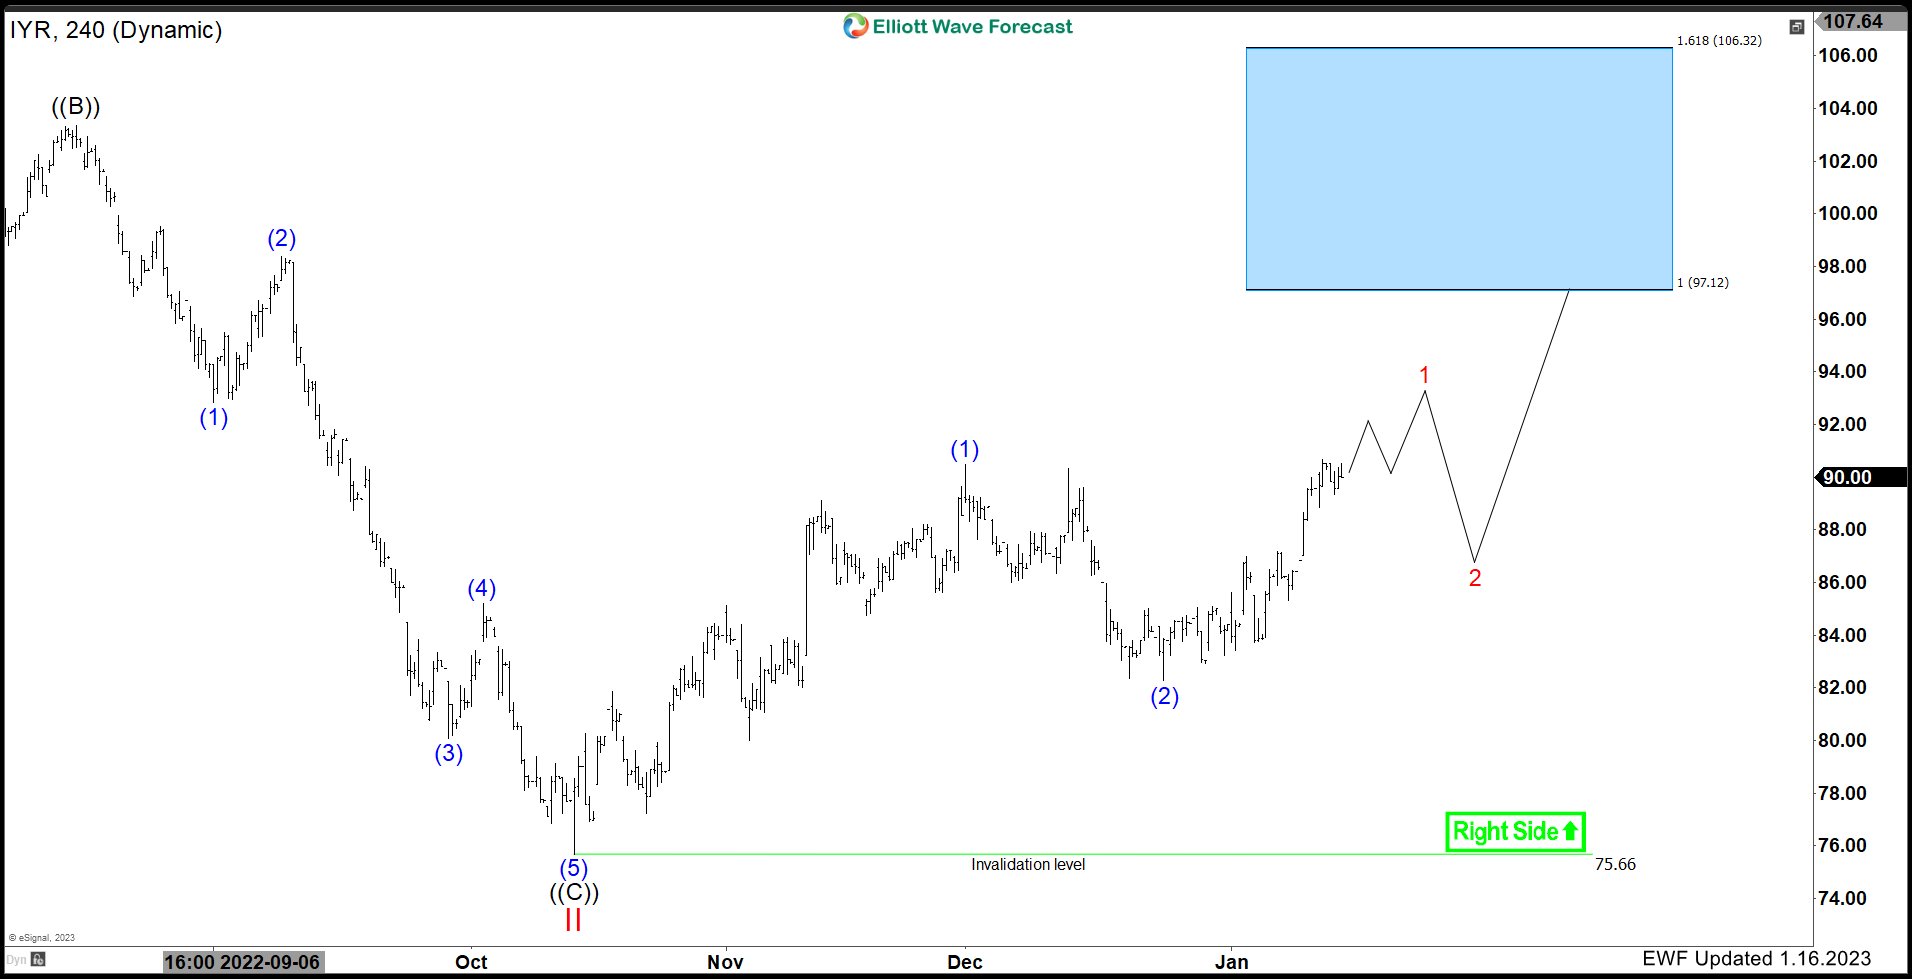
$IYR 4H Elliott Wave Analysis Jan 16 2023:
The 4H chart above is showing the path in $IYR since Oct lows. The ETF is favoured to have struck a low at $75.66 and is bouncing to correct the cycle against all time highs. So far, the bounce from Oct lows unfolded in 5 waves with divergence at blue (1). The pullback in (2) unfolded in a corrective 3 waves structure and found buyers at $82.28. The bounce extended and ended breaking above blue (1) peak at $90.47 which in our system opened a bullish sequence in the 4H timeframe. As long as $82.28 lows hold, we expect $IYR to continue higher and reach 97.12 – 106.32 before a reaction lower can take place. We like to buy dips in 3, 7 or 11 swings against blue (2) targeting the equal legs area.
$IYR Video Analysis Jan 16 2023:
Elliott Wave Forecast
We cover 78 instruments, but not every chart is a trading recommendation. We present Official Trading Recommendations in the Live Trading Room. If not a member yet, Sign Up for 14 days Trial now and get access to new trading opportunities.
Welcome to Elliott Wave Forecast!
Back

