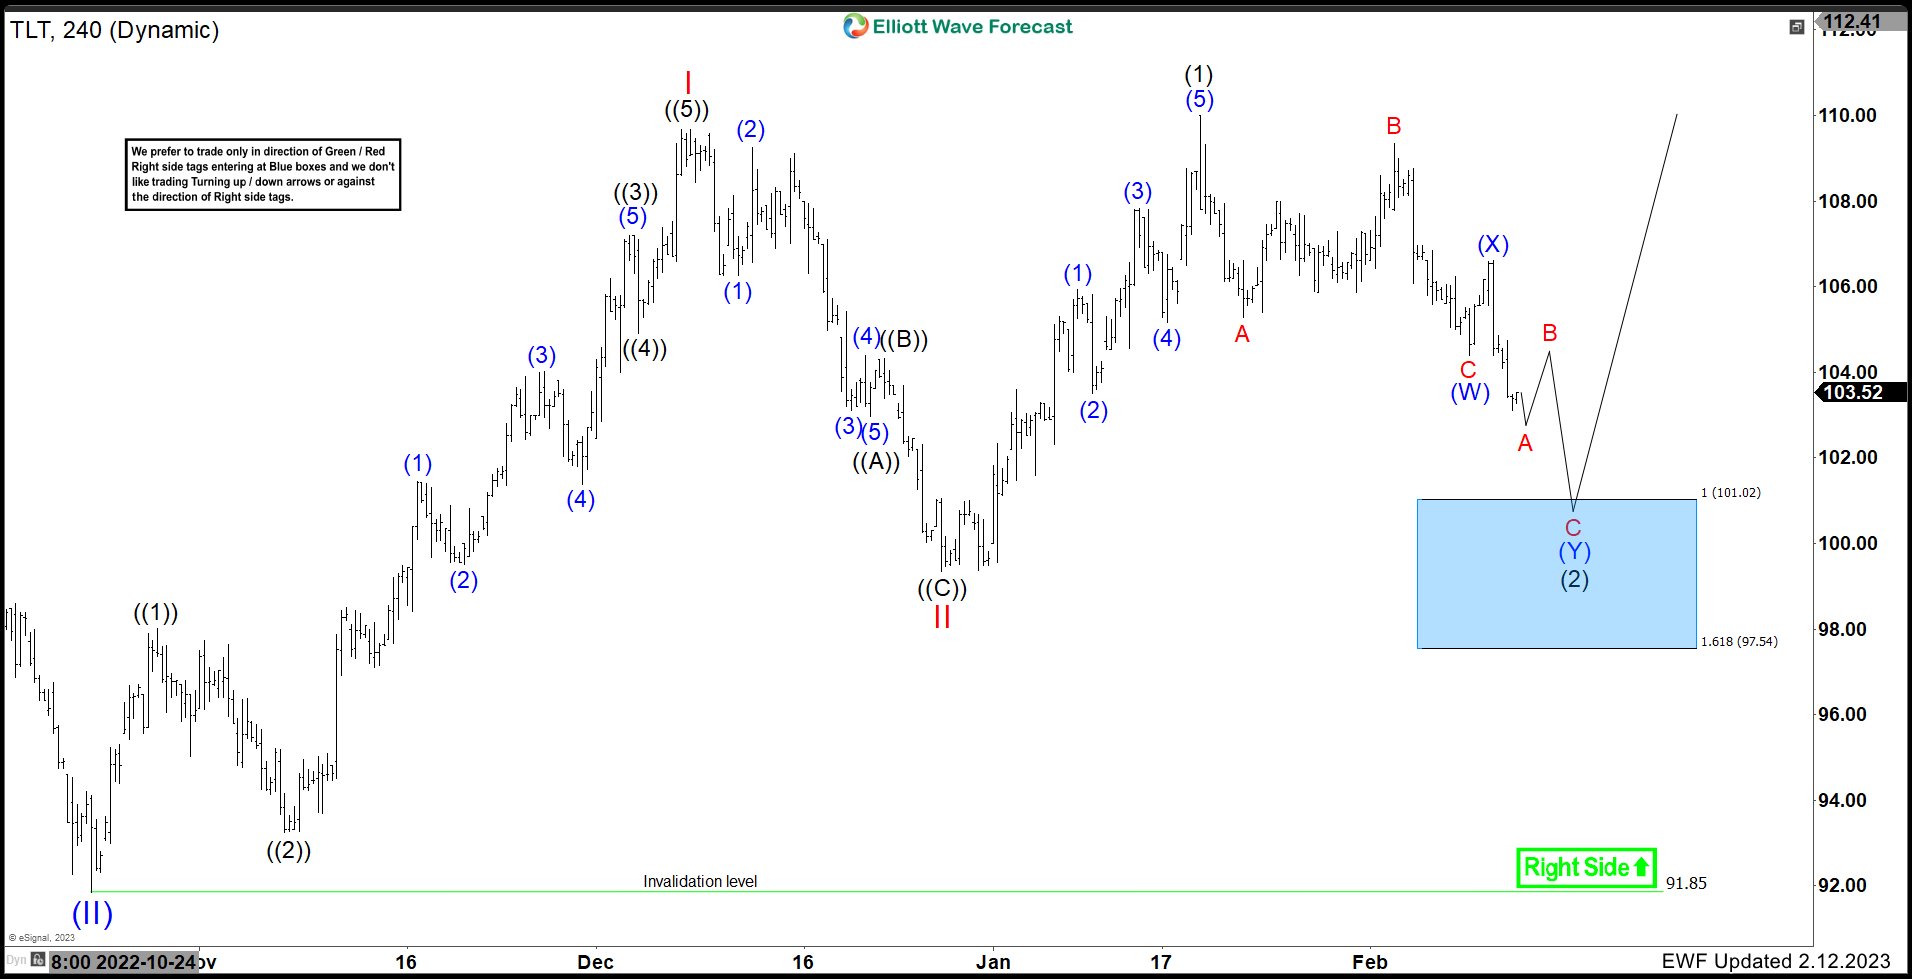
Hello Everyone! In this technical blog, we are going to take a look at the Elliott Wave path in the 20 Year Bond ETF ($TLT).
The iShares 20+ Year Treasury Bond ETF seeks to track the investment results of an index composed of U.S. Treasury bonds with remaining maturities greater than twenty years.
The 4H chart above is showing the path in $TLT since Oct 2022 lows. The ETF is favoured to have struck a low at $91.85 and bounced in 5 waves. After completing the 5 waves, a pullback to correct that cycle took place and ended at red II. Since that low, another 5 wave rally took place and broke above the red I peak creating a bullish sequence. So far, the cycle from Dec lows ended and a 7 swing (WXY) pullback is taking place. Due to the bullish sequence and as long as the lows at $91.85 hold, we expect buyers to appear at the Blue Box area at 101.02 – 97.54.
Elliott Wave Forecast
We cover 78 instruments, but not every chart is a trading recommendation. We present Official Trading Recommendations in the Live Trading Room. If not a member yet, Sign Up for Free 14 days Trial now and get access to new trading opportunities.
Welcome to Elliott Wave Forecast!
Back

