Welcome traders. In this technical analysis we will look at a couple of XLF sector charts. This will show you how profitable and efficient it can be to trade with our philosophy and basic Elliott Wave application.
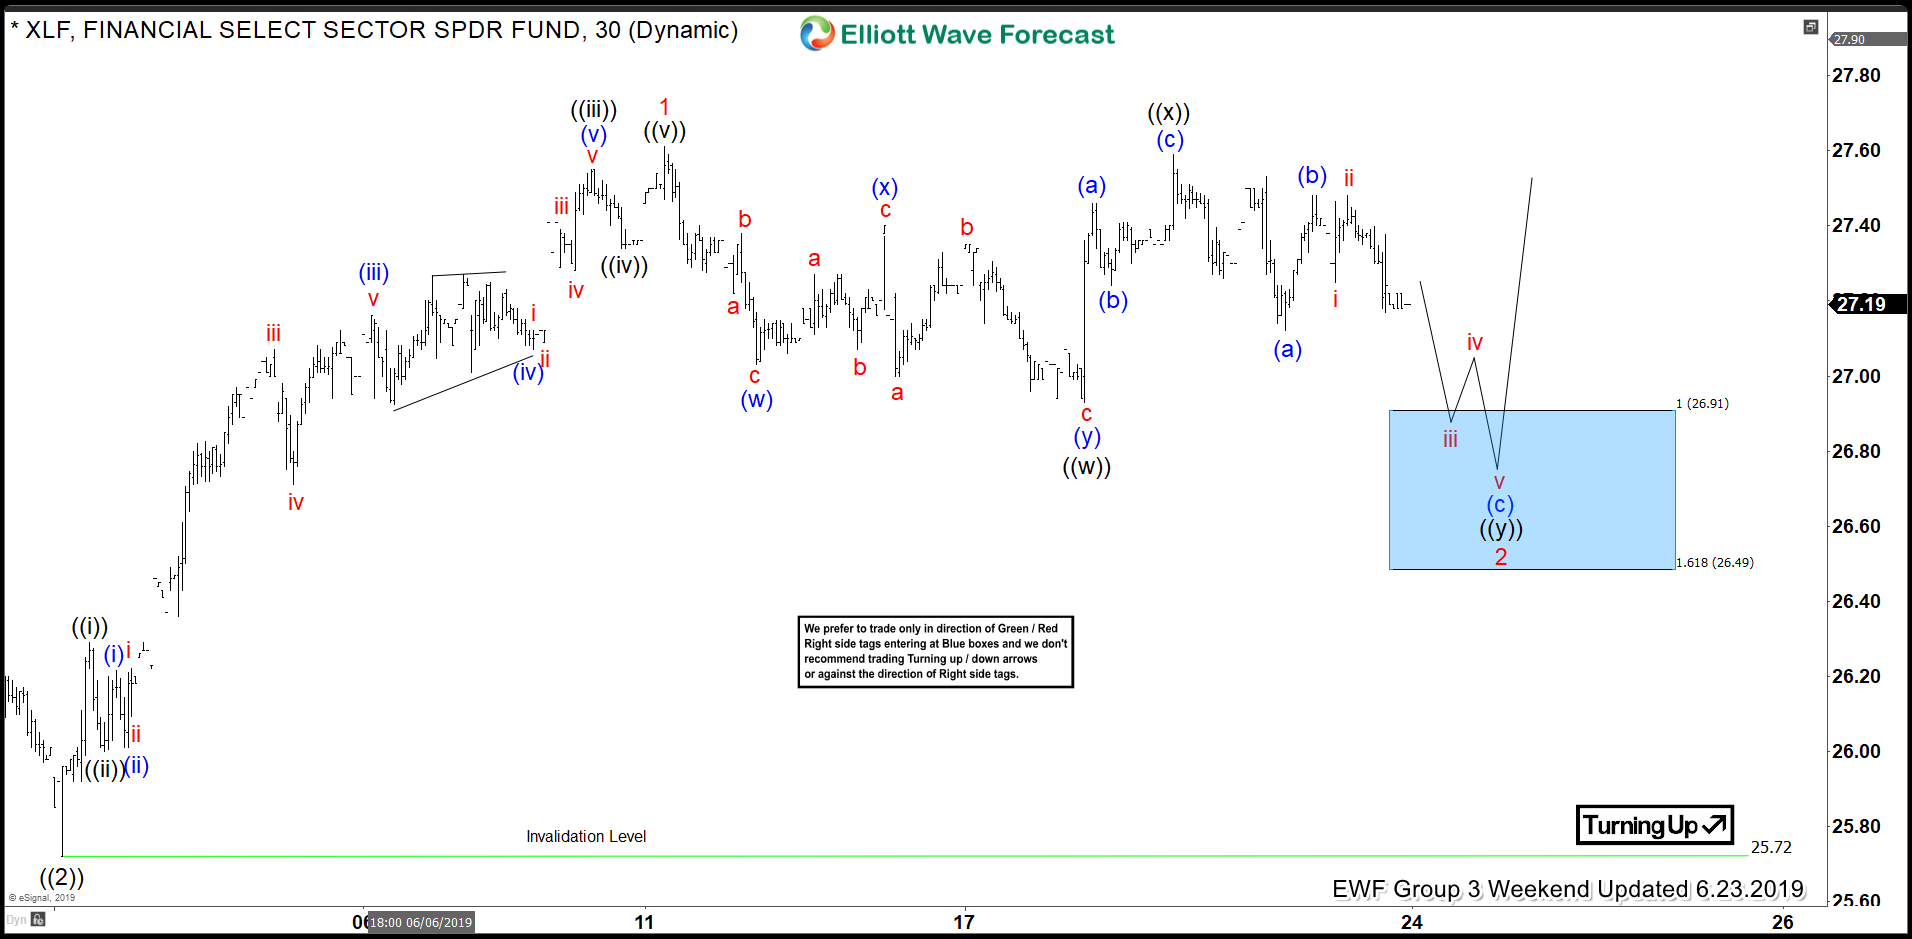
We start on June 23rd with a 30-minute chart presented to our members. At the time, we maintain a bullish sentiment based on a fully completed impulsive move to wave ‘1’. The $25.72 pivot served as support and more importantly as an invalidation level. From there, according to Elliott Wave theory, we expected a pullback to correct the impulsive move completed. After a couple of days of observation we are able to recognize an Elliott Wave double three structure.
Under our methodology, we encourage our members to take action with the right side of the market. Also, this corrective structure, allowed us to defined our blue box target area.When wave ((x)) is confirmed, a 1:1 minimum target and a 1:1.618 extreme target is derived. These targets are combined to provide a high probability area for a reversal (this are is illustrated as a blue box). To add to this, a crucial rule in our methodology is a sequence must finish as a complete 3,7 or 11 swing move. So, based on this, our members are fully encouraged to take long position in this particular case. The area within 26.91-26.49 now offered an 85% chance of a bounce once the price reached it.
XLF 6.23.2019 30-Min Chart Elliott Wave Analysis
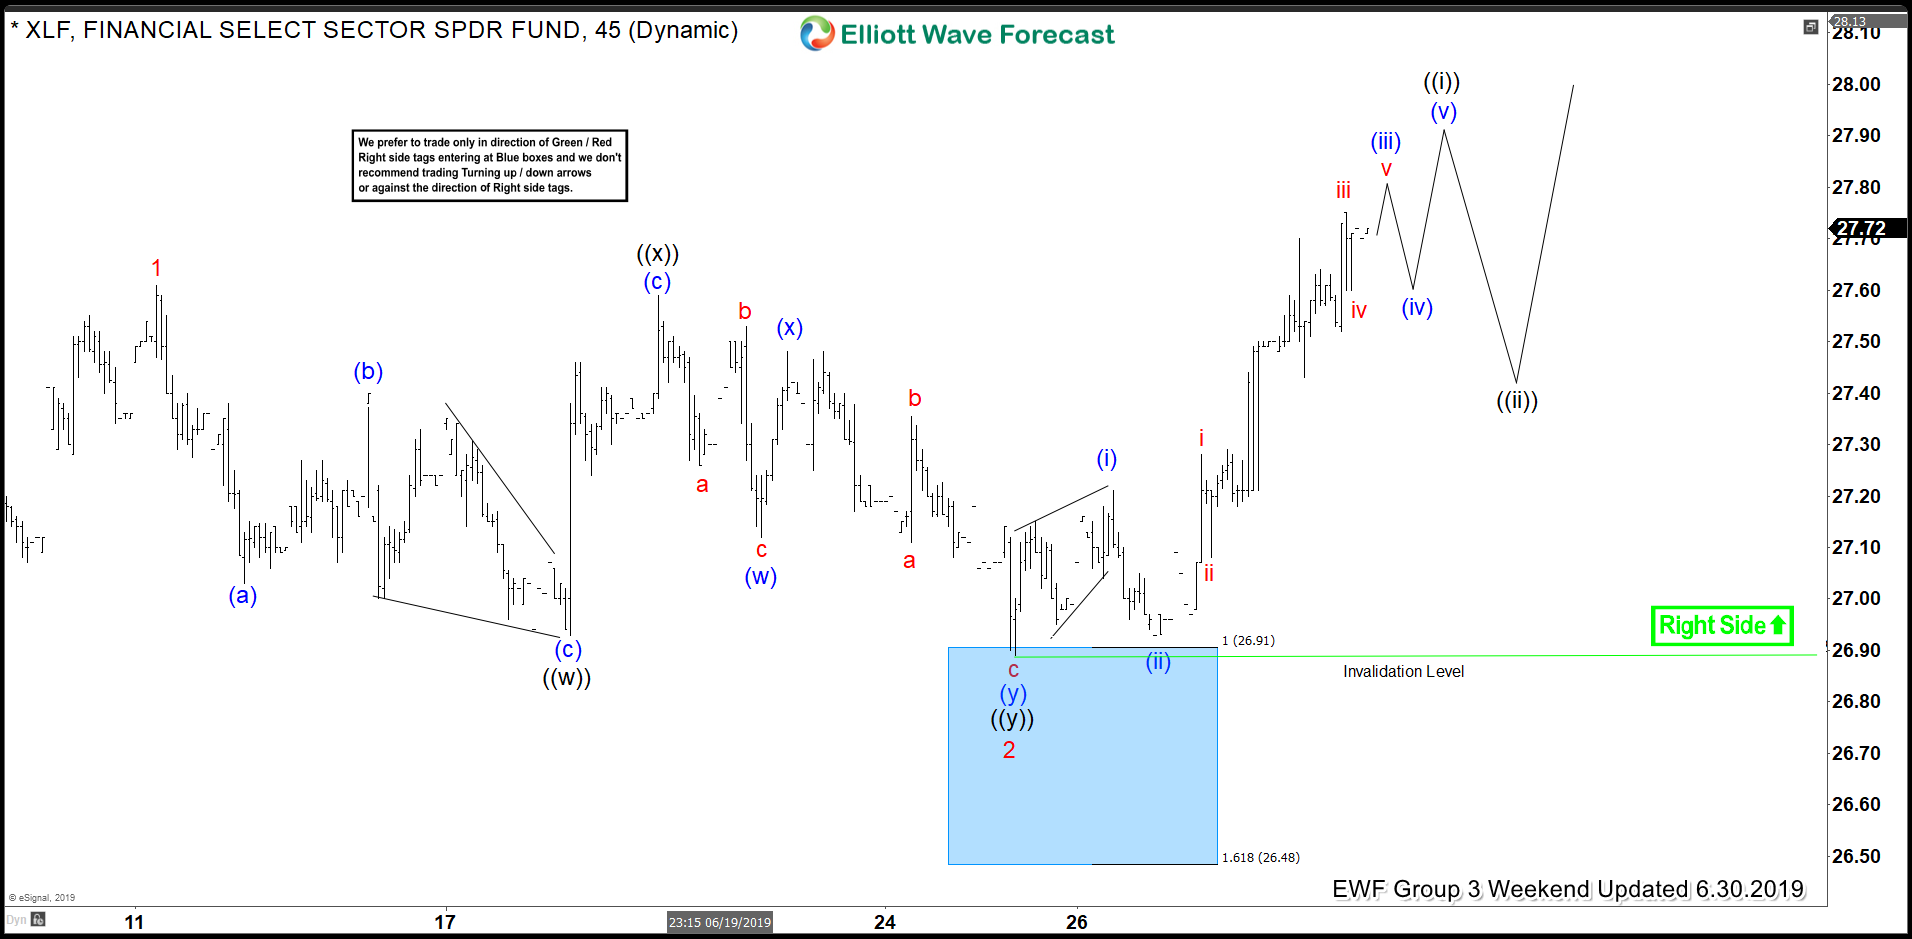
Below you can see an updated chart of the instrument from June 30th. Notice how the pair reacted off of the blue box target area and resumes the upside. Our members took a long trade in our Live Trading Room and now has a risk free trade with stop at break even. At this stage however, the pair is no longer at extreme area so we don’t recommend opening a new position. Certainly, trading is always about taking a chance. But, what can be better than taking a chance with probabilities on your side. With a mapped entry, an invalidation level set up, the right side, and sequences, add up to great trading opportunities. Above all, patience for the right signals to present themselves proved to be successful and we got the proposed reaction as expected.
XLF 6.30.2019 30-Min Chart Elliott Wave Analysis
If you like our analysis and our Elliott Wave theory application visit us at Elliott Wave Forecast. We cover 78 instruments in total for which we provide daily live analysis. Up-to-date Elliott wave analysis, and potential reversal target areas are always available. And if that was not enough, we provide support through a 24/7 chat room.
As always, new comers can always try us out for 14 days with our Trial Plan. Or, if you are ready, check out our available Subscription Plans.
Trading success is a journey and you will never be perfect at it, but you can always master your reaction to the market.
Back


