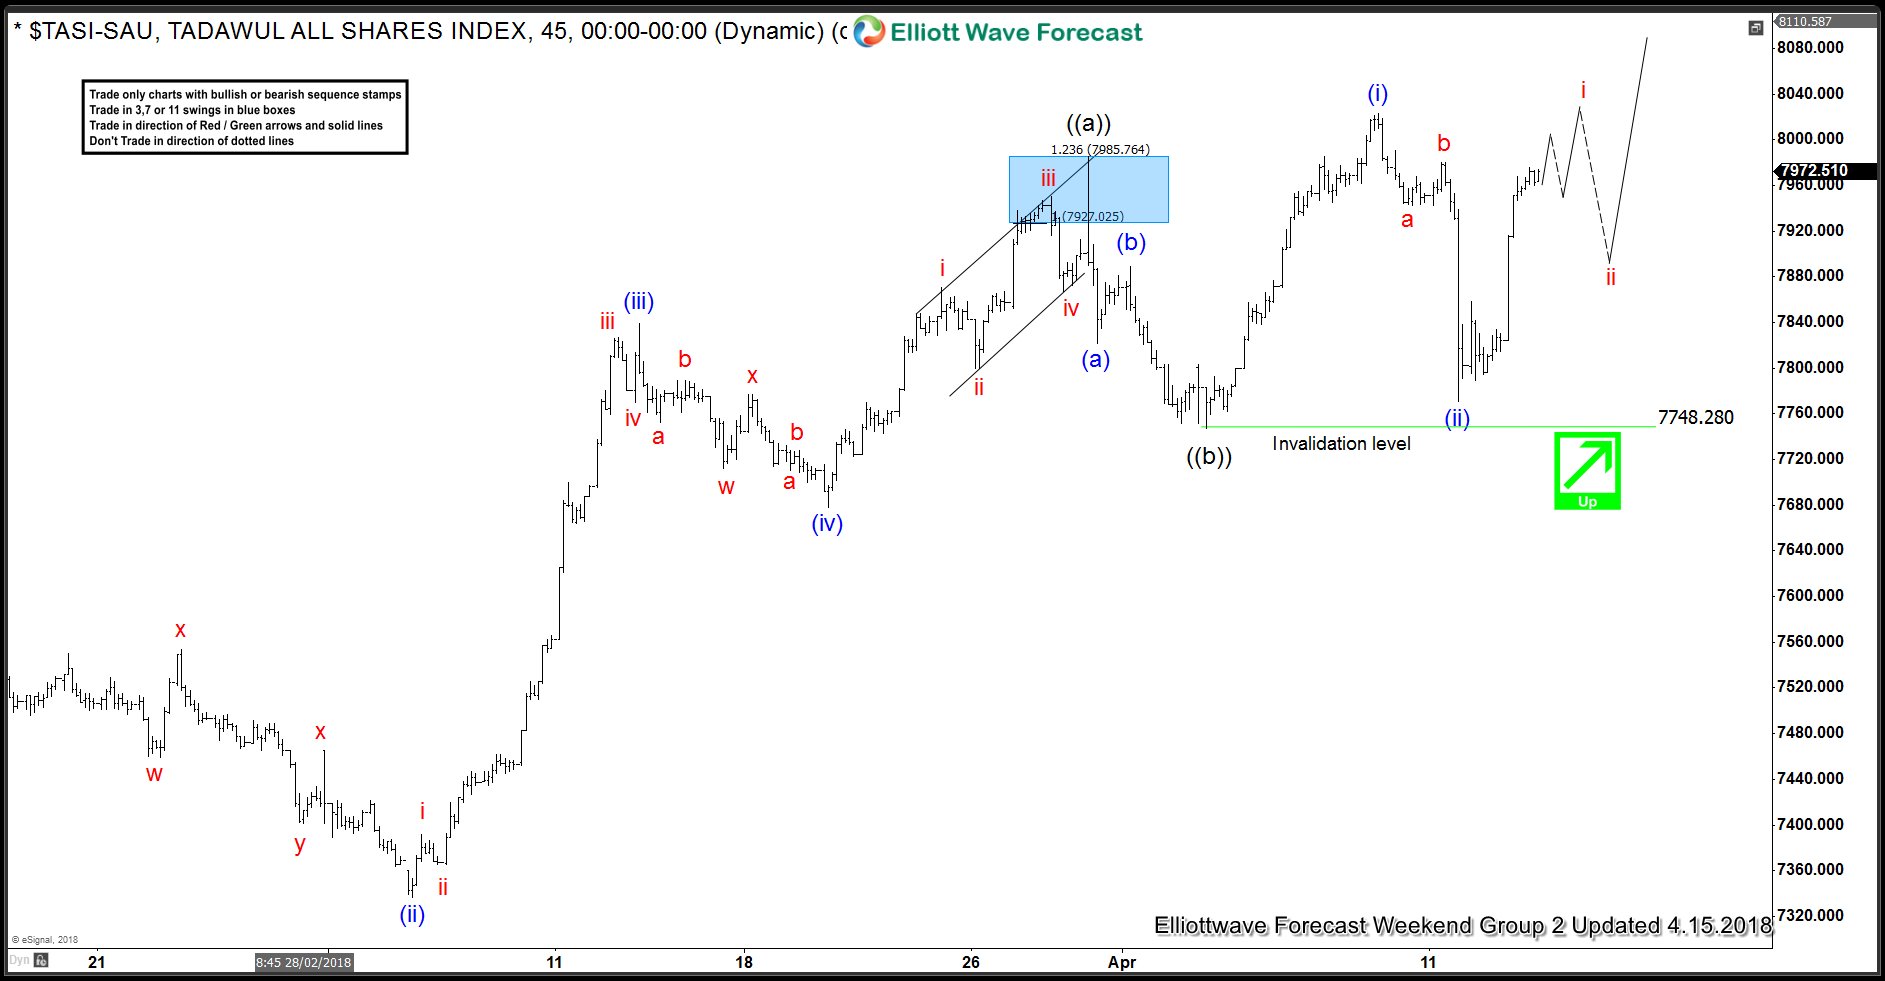
TASI (Tadawul All Shares) an index from Saudi Arabia Elliott Wave Analysis suggests that the cycle from 11/21/2017 is showing higher high sequence. Calling for more upside extension towards 8259.82-8484.56 area next before it ends that cycle and starts the pullback. So now let’s take a look at the shorter cycles from February 11.2018 low. Which showed the 5 waves impulsive rally in Minute wave ((a)) higher of a possible Zigzag pattern. Where internals of each leg was unfolded in 5 waves with extension thus suggested the impulsive sequence in the index.
The internals of Minute wave ((a)) ended in Minutte wave (i) at 7554.90, Minutte wave (ii) ended at 7336.41 & Minutte wave (iii) ended at 7839.28. Minutte wave (iv) ended at 7678.31 and Minutte wave (v) of ((a)) ended at 7985.55 high. Below from there, the index made a 3 waves pullback which then ended the Minute wave ((b)) pullback in 3 swings at 7748.28 low. Then above from there index went on to make a new high in another 5 waves thus suggest that the next extension higher in Minute wave ((c)) of a Zigzag structure has started. Where Minutte wave (i) of ((c)) ended at 8023.11 and Minutte wave (ii) of ((c)) also appears completed above 7748.28 low. As this level holds, rally is expected to resume in the Index towards 8259.82-8484.56 area from where it can make a larger pull back in 3-7-11 swings.
TASI (Tadawul All Shares) 1 Hour Elliott Wave Chart
Keep in mind that the market is dynamic and the FTSE Elliott Wave view could change in the meantime. Success in trading requires proper risk and money management as well as an understanding of Elliott Wave theory, cycle analysis, and correlation. We have developed a very good trading strategy that defines the entry.
Stop loss and take profit levels with high accuracy and allows you to take a risk-free position, shortly after taking it by protecting your wallet. If you want to learn all about it and become a professional trader then start today with our Free 14-day trial.
Back

