In this blog-post, I want to discuss and recap my Blog I did on the Dow Jones Transportation Index in December 2017. First of all, you need to understand that today’s market can advance in 2 types of sequences. The first type is 5-9-13 or motive sequence and the second type is the 3-7-11 or corrective sequence.
In the Decembers Blog, I mentioned that the Dow Jones Transportation Index (DJT) still favors more upside in the long-run. However, I mentioned also that it will soon end the 5th swing from 2009 low. And that we should be aware of a correction in the 6th swing before the stock market starts its possible last swing to the upside in the 7th swing.
Now, let’s shortly define again what the Dow Jones Transportation Index actually is.
The DJT is made off of the top 20 delivery, airline, trucking and railroad stocks. In the chart below you can see the companies listed in that index. The DJT is the oldest stock index which was created by Charles Dow in 1884.
The Dow Jones Transportation Average should be monitored to gauge the state of the U.S economy. The Dow Transportation Index is often a leading indicator to the Dow Jones 100. But we need to understand that it’s not a perfect gauge but it surely can give us an approximate path.
Lets now compare the chart which I did last year to the latest chart of the DJT.
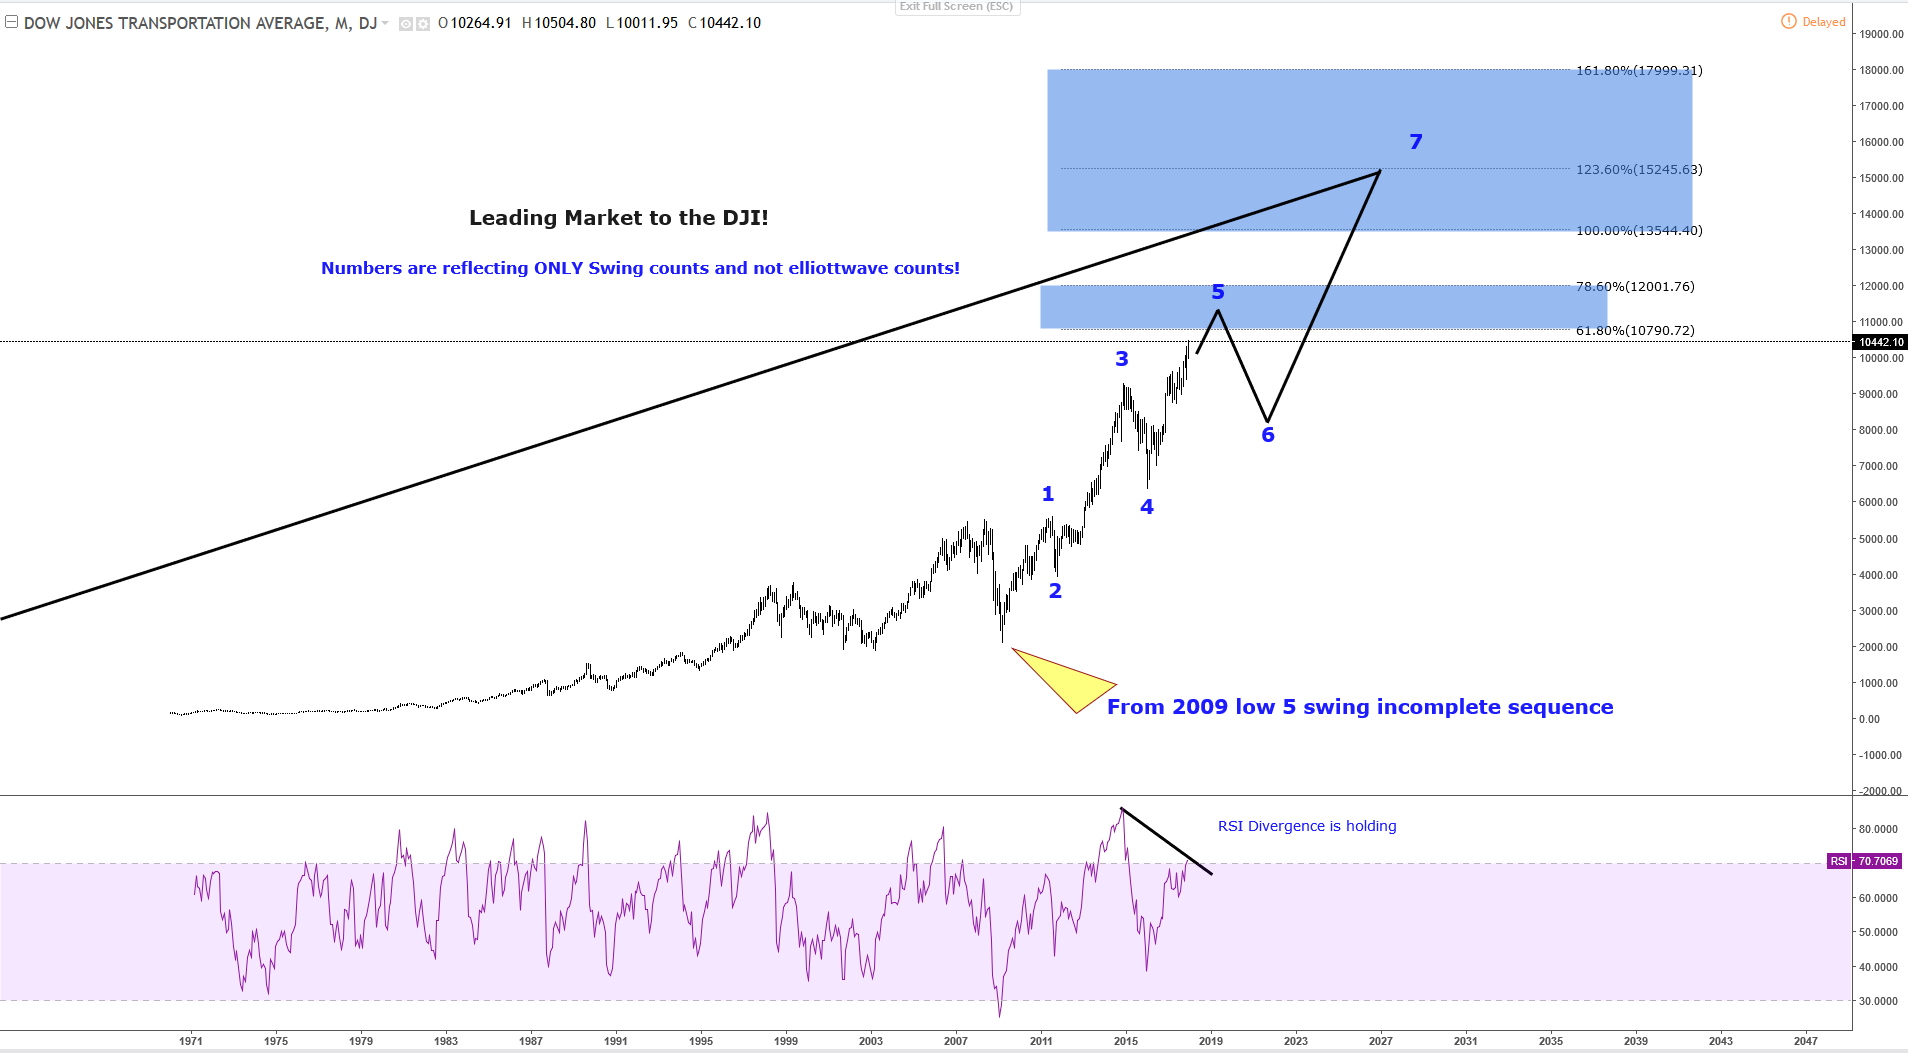
DJT 8/12/2017 Monthly Chart
In the chart below you can see the chart of the DJT. Where I said last year that the DJT can end the possible 5th swing in the 0.618-0.786 Fibonacci Extension area and that we should expect a moderate correction in the 6th swing. That will drag the Dow Jones Industrial Average 100 also into a bigger correction. You can read the blog on Dow Jones Transport Average here from last year

Now, let’s have a look at the latest DJT chart.
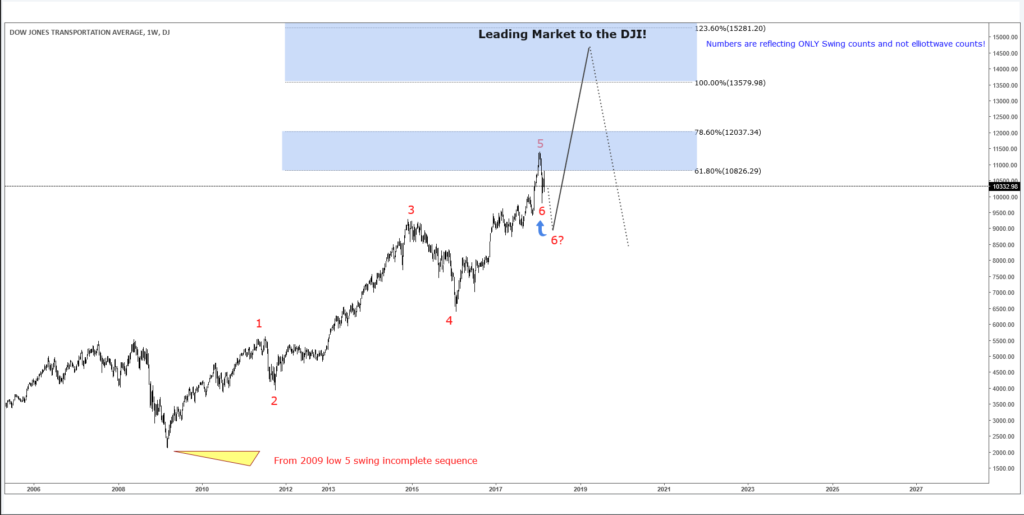
DJT 3/5/2018 Weekly Chart
You can see in the image below that the DJT reached the forecasted area of the 0.618-0.786 Fibonacci Extension. It has ended the 5th swing in that area. So, we already were prepared for a decent correction in the stock market. At this moment in time, it needs to be seen whether the 6th swing correction is over yet, or whether we can see another leg of weakness in the stock market. In either case, the right side proved us again that buying in the stock market is still the right trade within the market. It is again just a matter of time when the next rally will occur.
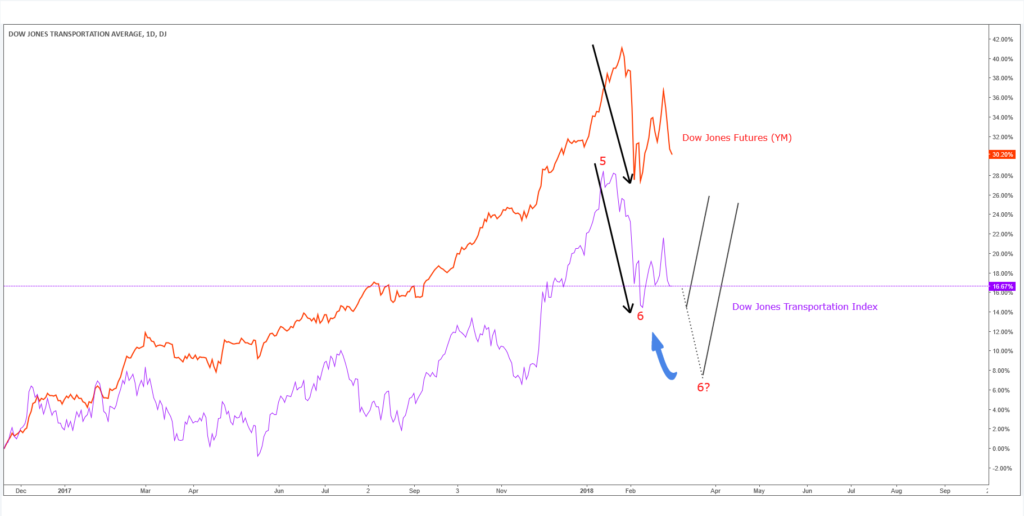
Dow Jones Industrial Average vs Dow Jones Transportation Index
In the last chart below you can see the Dow Jones Industrial Average 100 compared the DJT. You can nicely see, after calling the 5th swing completed in the DJT (purple line) the Dow Jones (Red Line) also followed a similar path of weakness. Like I said already above. It needs to be seen at this stage whether we can see another leg lower. In that case, we could assume that the Dow Jones Industrial Average will also see another leg of weakness. Or the DJT holds the low and finished already the 6th swing and now starts the next really. In either case, we like them to the upside in the longterm perspective.
I hope you liked this blog and I wish you all good trades. Don’t forget to sign up for a 14 days FREE trial.
We believe in cycles, distribution, and many other tools in addition to the classic or new Elliott wave Principle. To get a regular update on the market and Elliott wave charts in 4-time frames, try our service for 14 days for FREE. Click Here.
Back


