In this blog-post, I want to discuss with you guys, why we think that the Dow Jones Transportation Average can still see more upside.
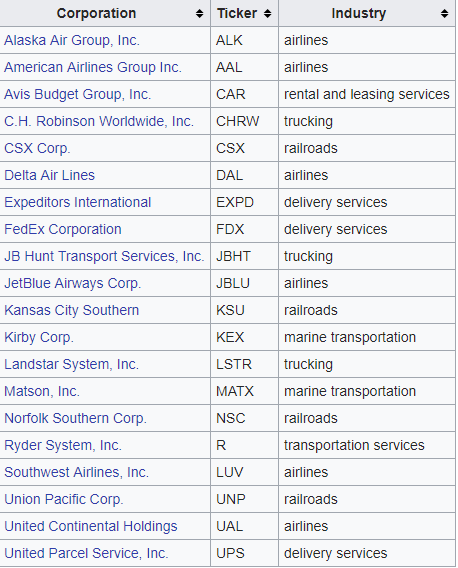
First of all, let me explain what the Dow Jones Transportation Average Index is. The DJT is made off of the top 20 delivery, airline, trucking and railroad stocks. In the chart below you can see the companies listed in that index. The DJT is the oldest stock index which was created by Charles Dow in 1884.
Dow Jones Transportation Index Companies
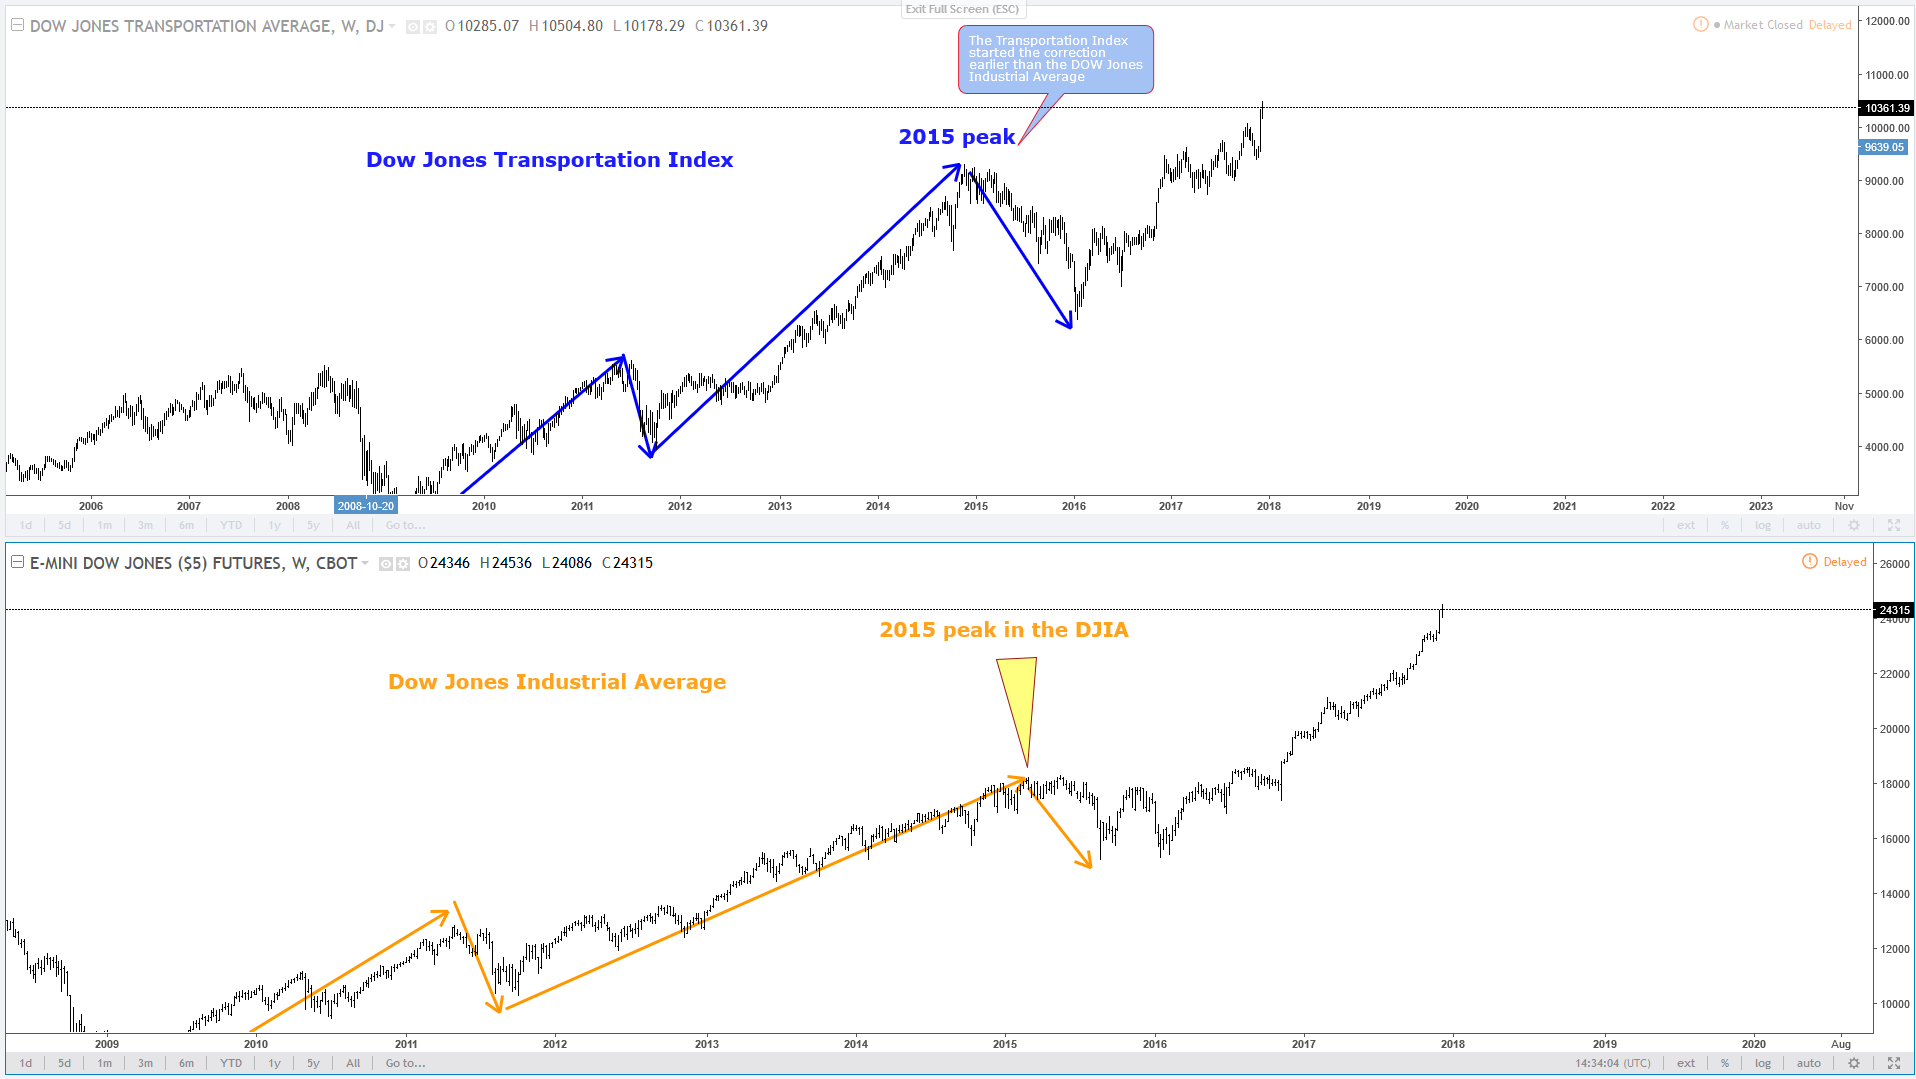
But why do we need to take this specific index into consideration? Well, The Dow Jones Transportation Average is closely monitored by economists to gauge the state of the U.S economy, especially by people who follow the Dow Theory. The Dow Transportation Index is often a leading indicator of where the Dow Jones Index is overall heading because people and businesses ship and sends more stuff when the economy, (especially the business economy) is doing well, and they pull back when it isn’t. Obviously, we need to understand that it’s not a perfect gauge but it surely can give us an approximate path. Anyway, if you have an overall look at the index you can make out that it’s a kind of leading indicator to the U.S. indices. Especially with the Dow Jones Industrial Average in comparison.
Dow Jones Transportation Index vs Dow Jones Industrial Average Weekly Charts
You can see in the chart above that the DJT (First chart) topped in 2015 first, whereas the Dow Jones industrial average was still rallying to the upside before turning lower as well. This is only one of many examples you can find when comparing them together.
Now, let’s have a more detailed look at the DJT.
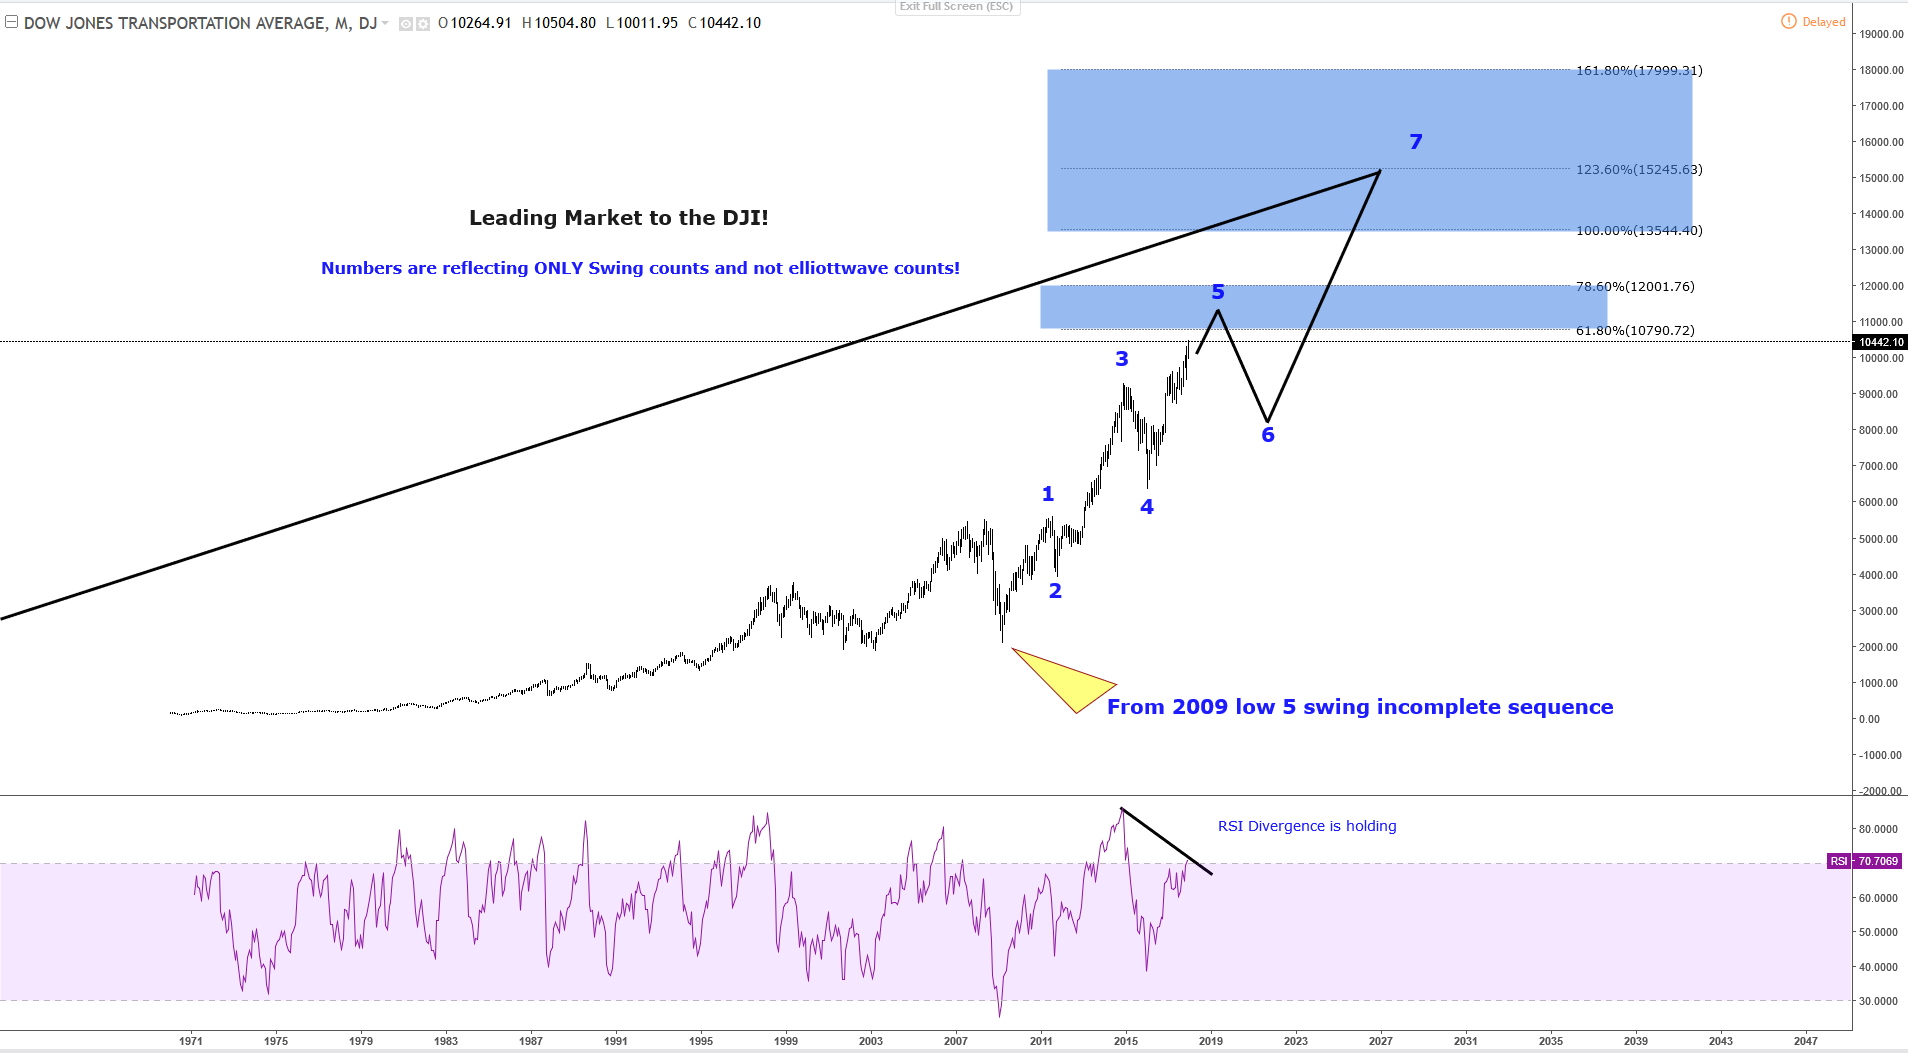
Dow Jones Transportation Index Monthly Chart
First of all, you need to understand that today’s market can advance in 2 types of sequences. The first type is 5-9-13 or motive sequence and the second type is the 3-7-11 corrective sequence. The Dow Jones Transportation Index is in a corrective sequence, where the market is currently in the 5th swing which needs to come with RSI divergence. That confirms that the market is from 2009 unfolding a 5 swing incomplete sequence and consequently it has not reached the 100% from 2009 low. However, soon a correction in the 6 swing should occur. But in the long term view, we still remain bullish. This chart can just be another confirmation that indices could still make another push higher. Please also read this article here which we wrote about global indices: https://elliottwave-forecast.com/stock-market/world-stock-index-has-much-more-upside/
At Elliottwave-Forecast, we believe that there’s only one Market. Having more than 2 Indices calling more upside mean the whole group will trade higher eventually. We believe in cycles, distribution, and many other tools in addition to the classic or new Elliott wave Principle. To get a regular update on the market and Elliott wave charts in 4-time frames, try EWF 14 days for FREE.
If you enjoy this article, check our work and join 14 days Trial to see Elliott Wave Forecast in 4-time frames for 78 instruments as well as getting access to Live Trading Room, Live Session, and more.
Back


