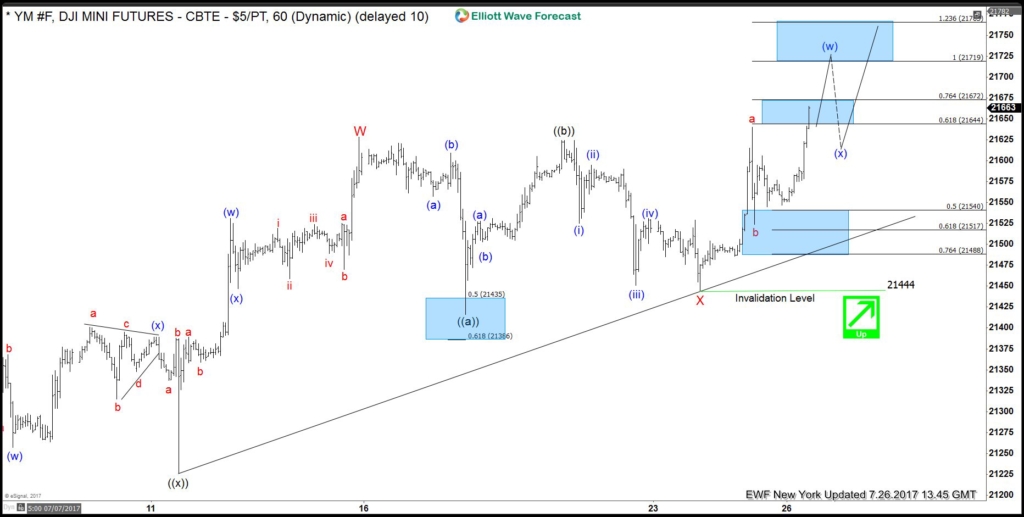
Short term YM_F (Dow E-Mini Future) Elliott Wave view suggests the rally from 6/29 low is unfolding as a double three Elliott wave structure and ended with Minor wave W at 21628. Down from there, Minor wave X pullback unfolded as a running Elliott Wave flat. Minute wave ((a)) ended at 21457, Minute wave ((b)) ended at 21624, and Minute wave ((c)) of X ended at 21444. Index has since made a new high suggesting the next leg higher has started. Up from 21444 low, Sub Minutte wave a ended at 21640. And Sub Minutte wave b pullback ended at 21524, while above there expect Index to extend higher again.
Near term focus remains towards 21719-21769 100%-123.6% extension area from 21444 low to end the Minutte wave (w) higher then index has scope to see a pullback, which should then find buyer’s again in sequence of 3, 7 or 11 swings for further upside provided the pivot at 21444 low remains intact. We don’t like selling the Index and favors buying the dips against 21444 low in the first degree. If pivot at 21444 low fails during later pullback, then we can consider the move up from 6/29 low (21138) as a 5 waves diagonal. In this case, Index should then pullback to correct cycle from 6/29 low in 3, 7, or 11 swing before further upside is seen.
Dow E-Mini Future 1 Hour Elliott Wave Chart
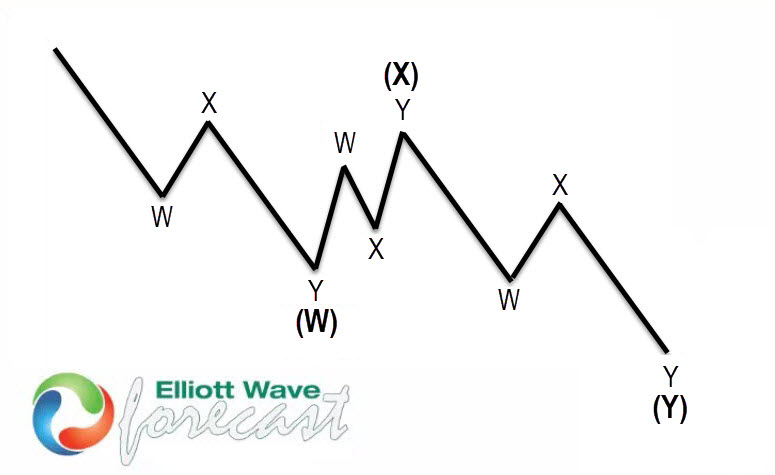
7 swings structure is one of the most common patterns in the theory of New Elliott Wave & it is also mainly know as double three Elliott Wave pattern. Market find that very often nowadays in many instruments in almost all time frames. It is a very reliable structure by which we can make a good analysis and what is more important is giving us good business inputs with clearly defined levels invalidation and destination areas.
The image below shows what Elliott wave pattern Double Three looks like. It has (W), (X), (Y) and 3,3,3 internal structure, which means that all these 3 legs are corrective sequences. Each (W), (X) and (Y) are made of three waves, which are having the structure W, X, Y in lesser degree as well. Elliott Wave principle is a form of technical analysis that traders use to analyze the cycles of financial markets and market trends forecast by identifying extremes in investor psychology, high and low prices, and other collective factors. Important to Note that 3 waves could also be labeled ABC (5-3-5) structure as well. How are labeled 3 waves it depends on the internal price structure subdivisions waves i.e. whether the price action is corrective or motive.
Back


