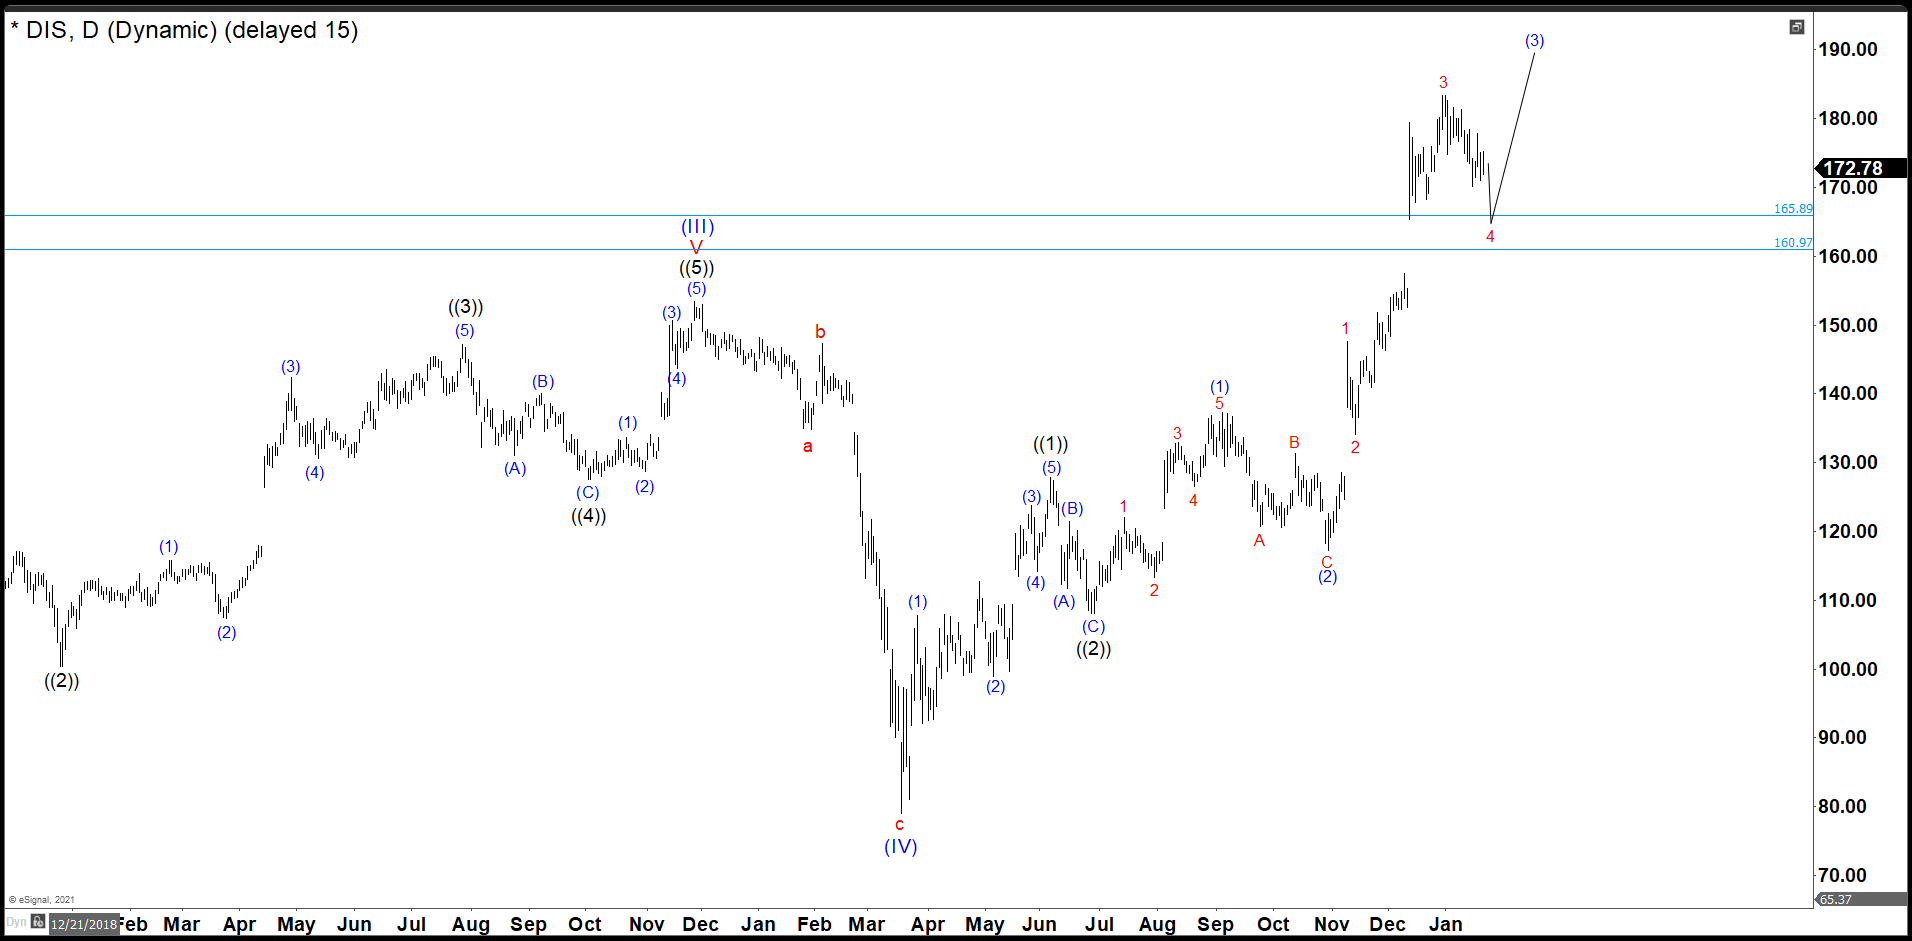
Since the crash of March 2020, all stocks have tried to recover what they lost and Disney was no exception. Disney did not only recover the lost, but It also reached historic highs. Now, we are going to try to build an impulse from the March 2020 lows with a target around $230. Target measured from 0 to 2019’s high projected from March’s low, equal legs.
As we see in the daily chart, the waves ((1)) and ((2)) of the impulse have completed and in this moment we are building the wave ((3)). We believe that wave (3) of ((3)) is still developing and we need one more high to complete an impulse 1, 2, 3, 4, 5 in red and end wave (3) of ((3)).
Disney 30 minutes chart
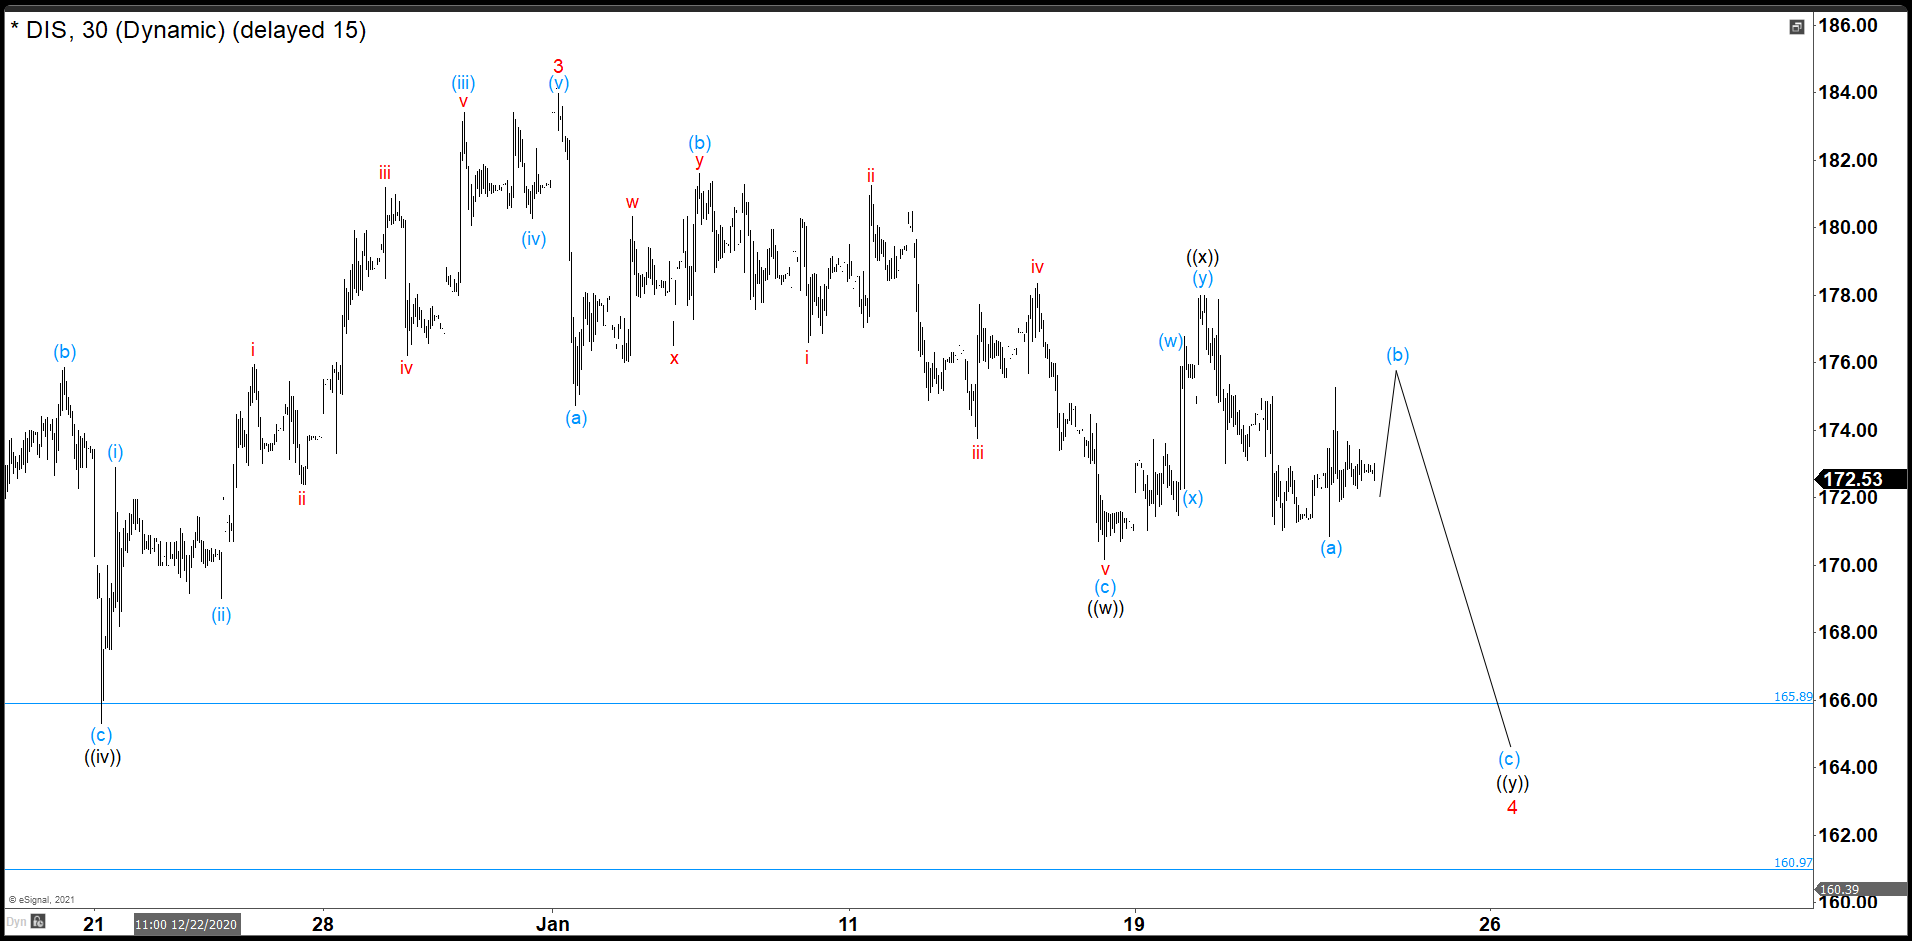
In this chart we are in wave 4 of (3). Disney built 3 waves to the downside (a), (b), and (c), where (a) and (c) are impulses, and the wave (b) is a double correction. (If you want to learn more about Elliott Wave Theory, please follow this link: Elliott Wave Theory). However, the closeness of the price to the low of 170.14 makes us think that we are going to see a double correction as wave 4. Therefore, we call the first 3 waves of the correction as ((w)) the short rebound is wave ((x)) and we need 3 more waves to the downside to complete the structure.
Actually, we finish the wave (a) of ((y)) and we are building wave (b). Only the breaking of the low of wave w would confirm the end of wave (b) and the beginning of wave (c) of ((y)). In the first instance, wave 4 should end within the price zone between 160.97 and 165.89.
In Elliottwave Forecast we update one-hour charts 4 times a day and 4-hour charts once a day for all our 78 instruments. We do a daily live session where we guide our clients on the right side of the market. In addition, we have a chat room where our moderators will help you with any questions you have about what is happening in the market at the moment. Let’s trial for 14 days totally free here: I want 14 days of free trial.
Back


