Disney (NYSE: DIS) surged to new all time highs in April 2019 confirming the breakout of the consolidation range that lasted for 3 years.
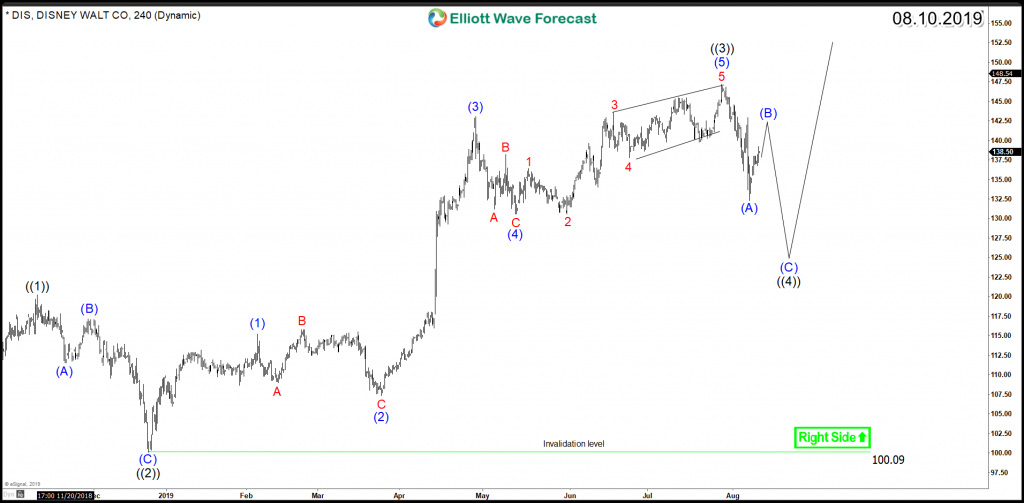
The rally from December 2018 low unfolded as an impulsive 5 waves structure which is part of the weekly cycle from 2016 low. The cycle ended on July peak from where a correction lower has started looking ideally for a 3 waves zigzag structure which can take the stock toward $129 – $123 area before the stock either resume the rally higher or bounce in 3 waves at least.
Disney DIS 4H Chart 08.10.2019
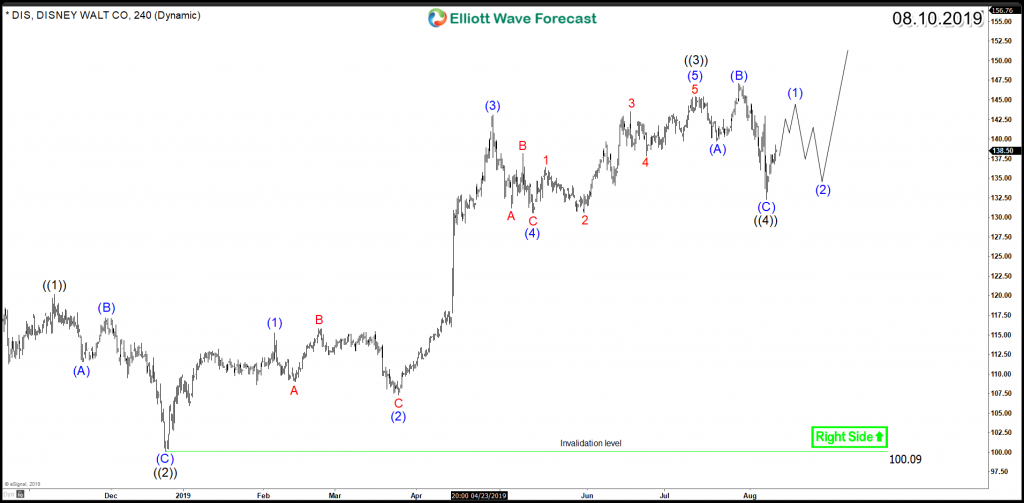
However, if DIS manage to rally higher without doing another leg lower, then the correction could have ended as a 3 waves flat structure so in that case the stock will remain supported above August low and it would aim for a move higher toward $150 – $156 area .
Disney DIS 4H Chart ( Aggressive View) 08.10.2019
In conclusion, Disney has bullish impulsive structure supporting the stock to find buyers in 3 or 7 swings pullback against December 2018 low $100 and it will be looking to make new all time highs after ending the current 4H correction.
Explore a variety of investing ideas by trying out our services 14 days and learning how to trade our blue boxes using the 3, 7 or 11 swings sequence. You will get access to our 78 instruments updated in 4 different time frames, Live Trading & Analysis Session done by our Expert Analysts every day, 24-hour chat room support and much more.
Back


