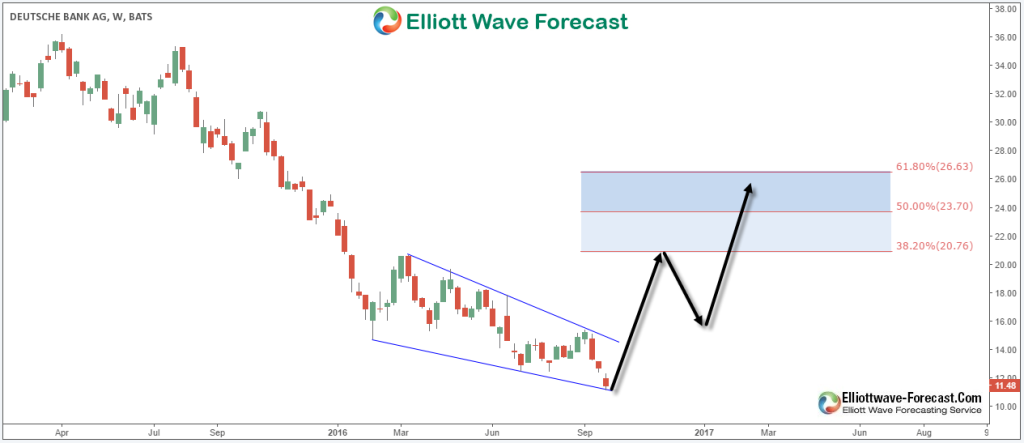
A month ago, everyone went crazy about the crash in Deutsche Bank stock price after hitting record new lows calling for a ” Lehman Brother ” reply scenario meaning the bank filling for bankruptcy . However the DB stock price was at the technical area to end at least the cycle from 03/14/2016 peak and start a 3 waves bounce , this view was supported as the stock was trapped in a falling wedge with a bullish divergence . Since making a new low in 09/30 at 11.19 , the stock started a rally surprising many bearish traders blinded by media talk and this recovery could extend later on to correct the cycle from 04/07/2015 peak and reach 20.76 – 26.63 area in larger 3 swings from the lows .
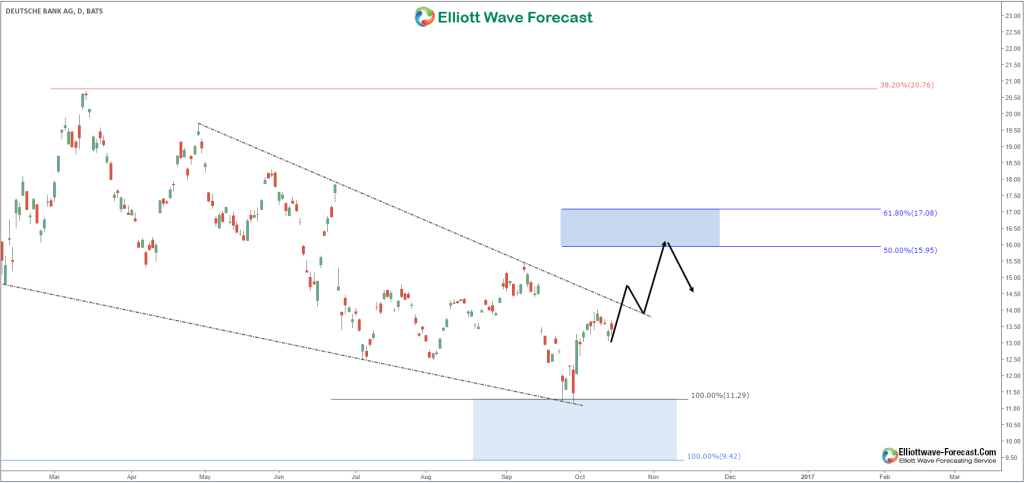
Daily chart of the stock is showing that it reached equal legs area at 11.29 where it ended the cycle from 03/14 peak and currently looking for 15.95 – 17.08 area to end 3 swings from lows , after that it should pullback in 3 waves before resuming higher as long as pivot at 11.19 low remains in place . The situation for Deutsche Bank could become more clear after it releases its third quarter results next Thursday .
For further information on how to find levels to trade forex, indices, and stocks using Elliott Wave and the 3 , 7 or 11 swings technique, try us free for 14 days. You will get access to Professional Elliott Wave analysis in 4 different time frames, Daily Elliott Wave Setup Videos , Live Trading Room and 2 live Analysis Session done by our Expert Analysts every day, 24 hour chat room support, market overview, weekly technical videos and much more so if you are not a member yet, use this opportunity and sign up to get your free trial . If you enjoyed this article, feel free to read other diversified articles at our Technical Blogs and also check Chart of The Day .
Back


