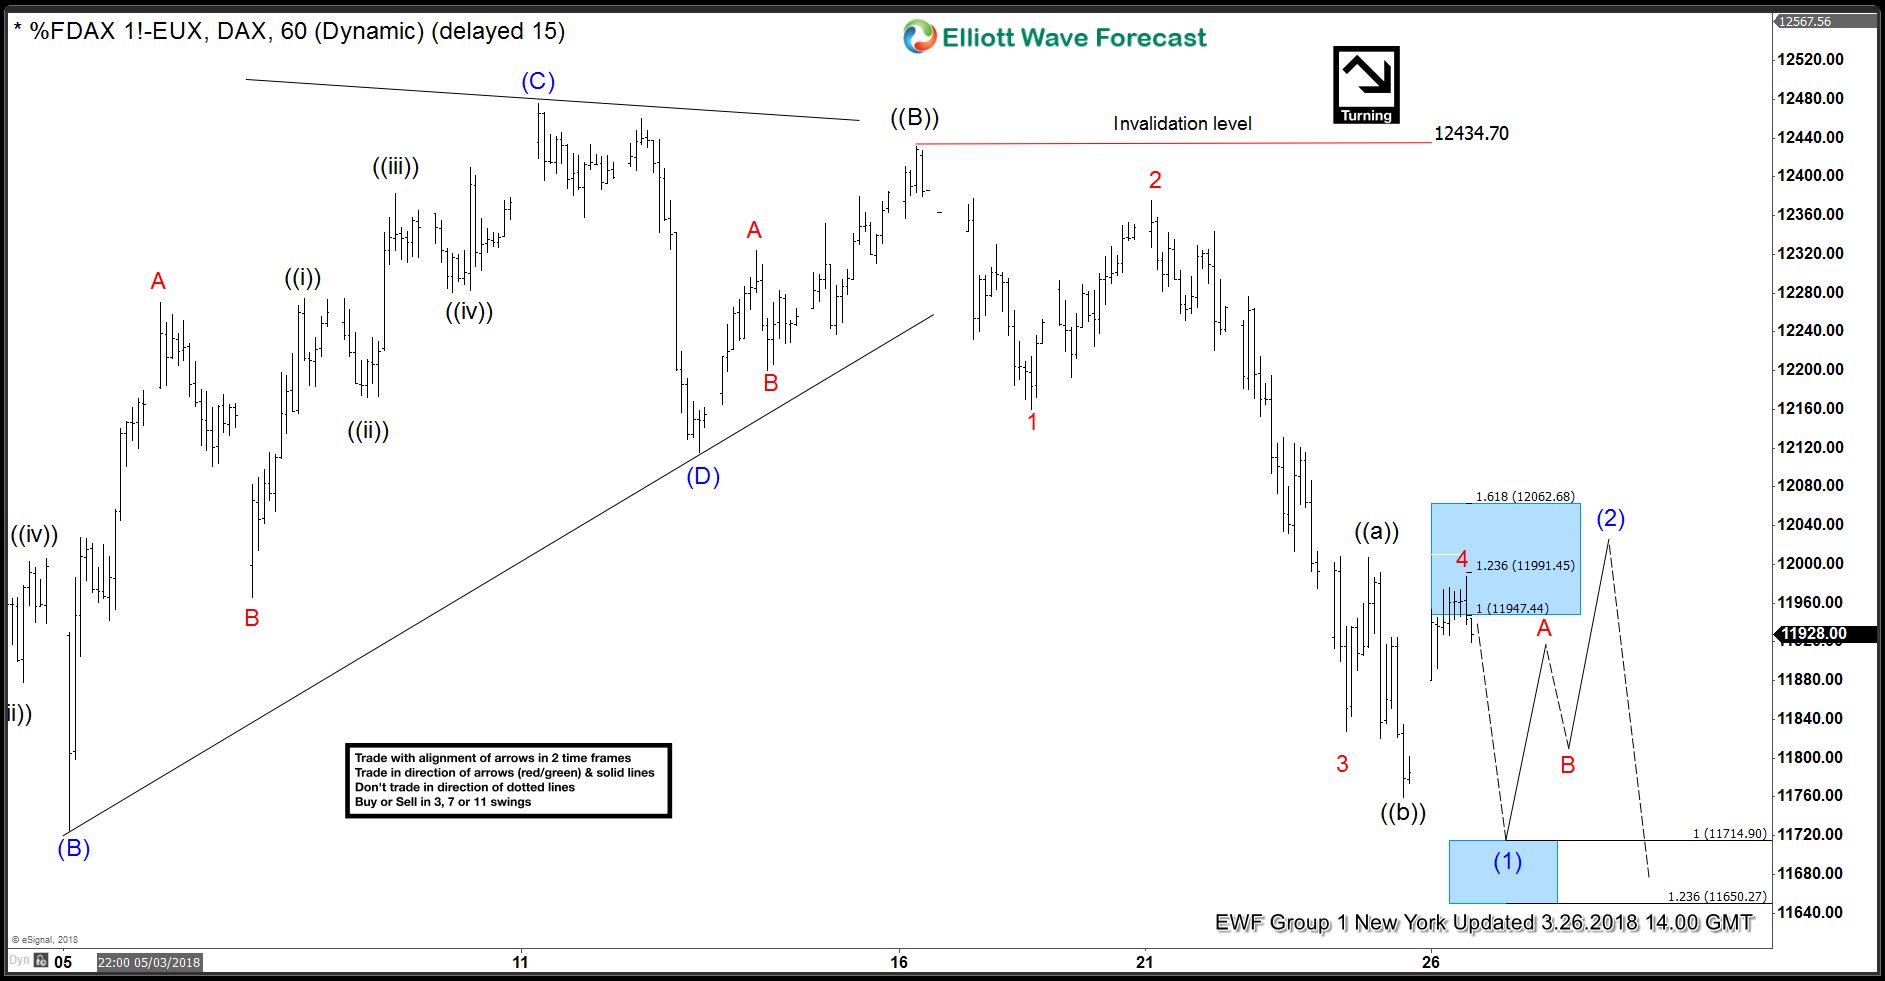
DAX Elliott Wave view suggests Index decline from 12434 was in 5 waves which we have labelled as wave (1) of ((C)) down from 1.23.2018 (13596) peak. Drop to 12160 completed wave 1, bounce to 12375 was wave 2 which was followed by a very sharp decline to 11827 to complete wave 3. Wave 4 took the form of a running FLAT Elliott wave structure and completed at 11987.50. Index then turned lower again and was expected to complete wave 5 between 11714.90 – 11650.27 which was inverse 1.236 – 1.618 Fibonacci extension area of wave 4 bounce.
DAX Elliott Wave Analysis: 3.26.2018 New York Update
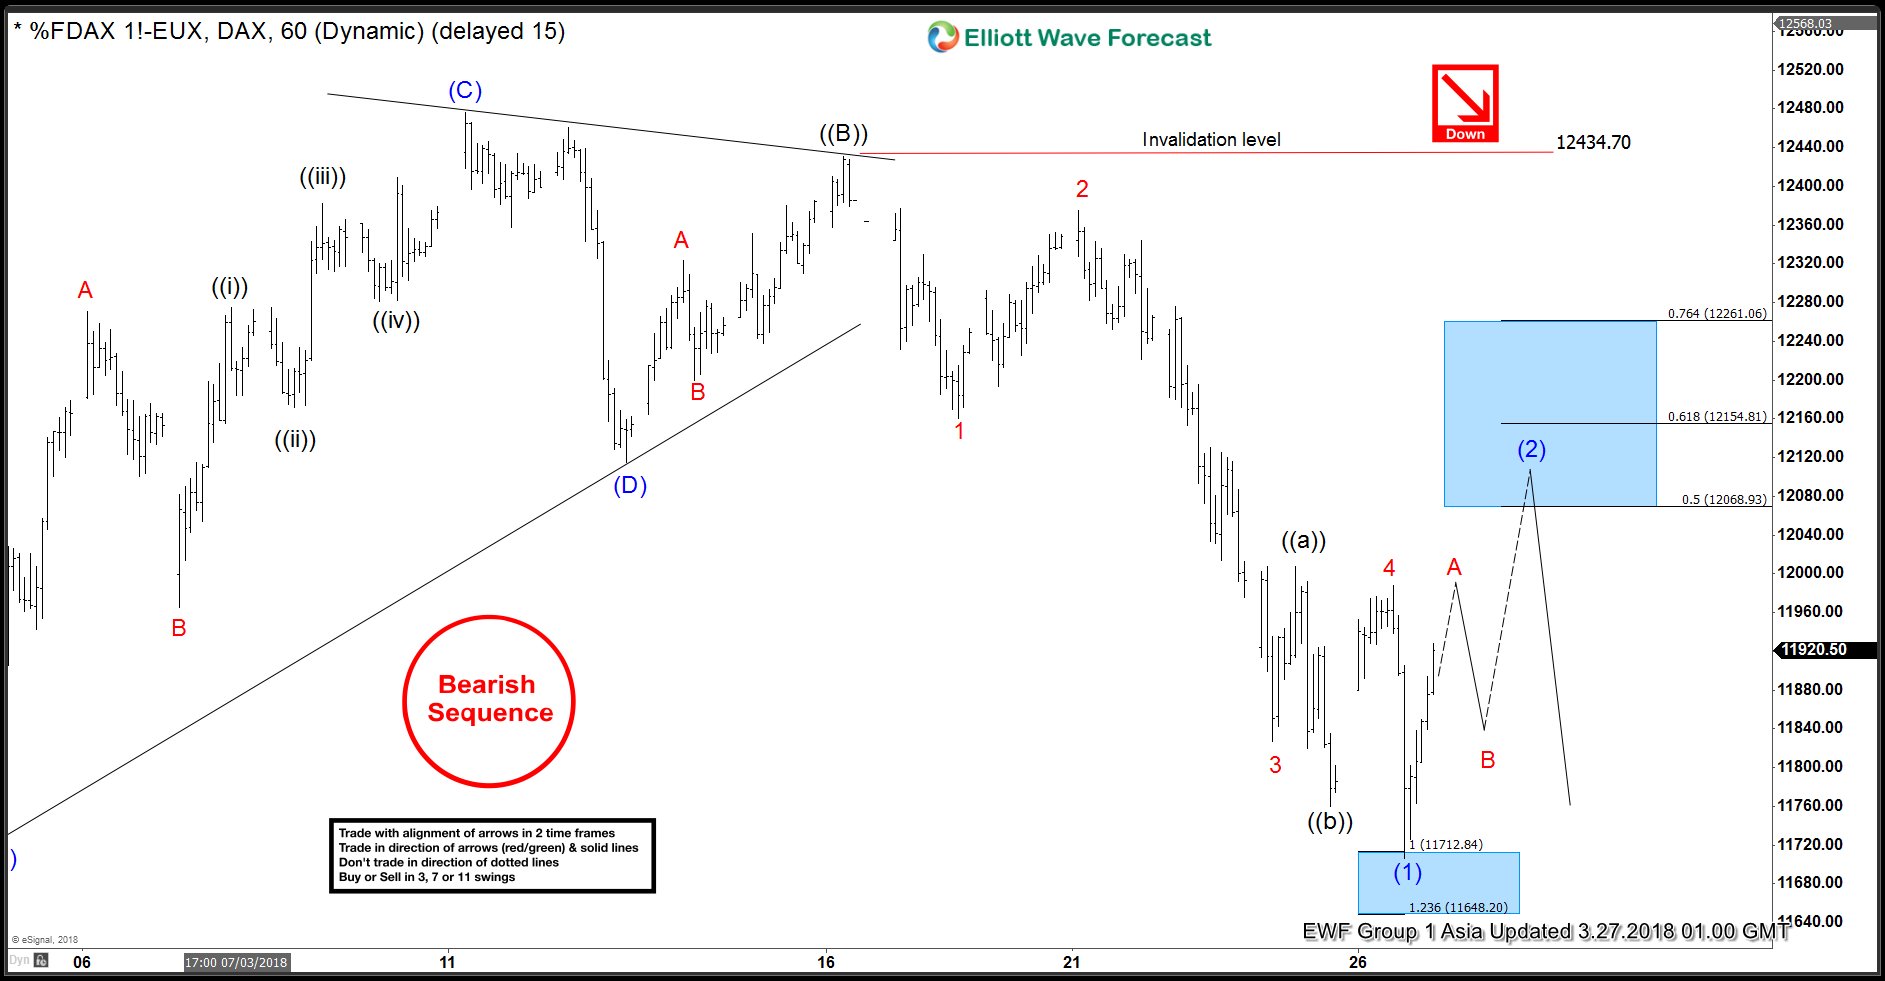
DAX did drop to a new low of 11706.50 as expected to complete proposed wave (1) of ((C)). According to Elliott Wave Theory, after 5 waves are completed, we should get a bounce or a pull back in at least 3 waves to correct the 5 waves move so the expectations were for a bounce in wave (2) to correct the decline from 12434 peak. Index started bouncing in wave (2) as shown in the chart below:
DAX Elliott Wave Analysis: 3.27.2018 Asia Update
Bounce in wave (2) was expected to unfold as a Zig-zag Elliott wave structure which is a 5-3-5 structure. However, it is worth mentioning that corrections can unfold in many different ways so wave (2) could have taken some other form as well like a Double Three Elliott Wave Structure or even a FLAT. Index finished wave A at 12030 and pulled back in wave B which was expected to hold above 11706.50 for another leg higher in wave C to complete wave (2). Let’s take a look at the chart below to see where we are currently.
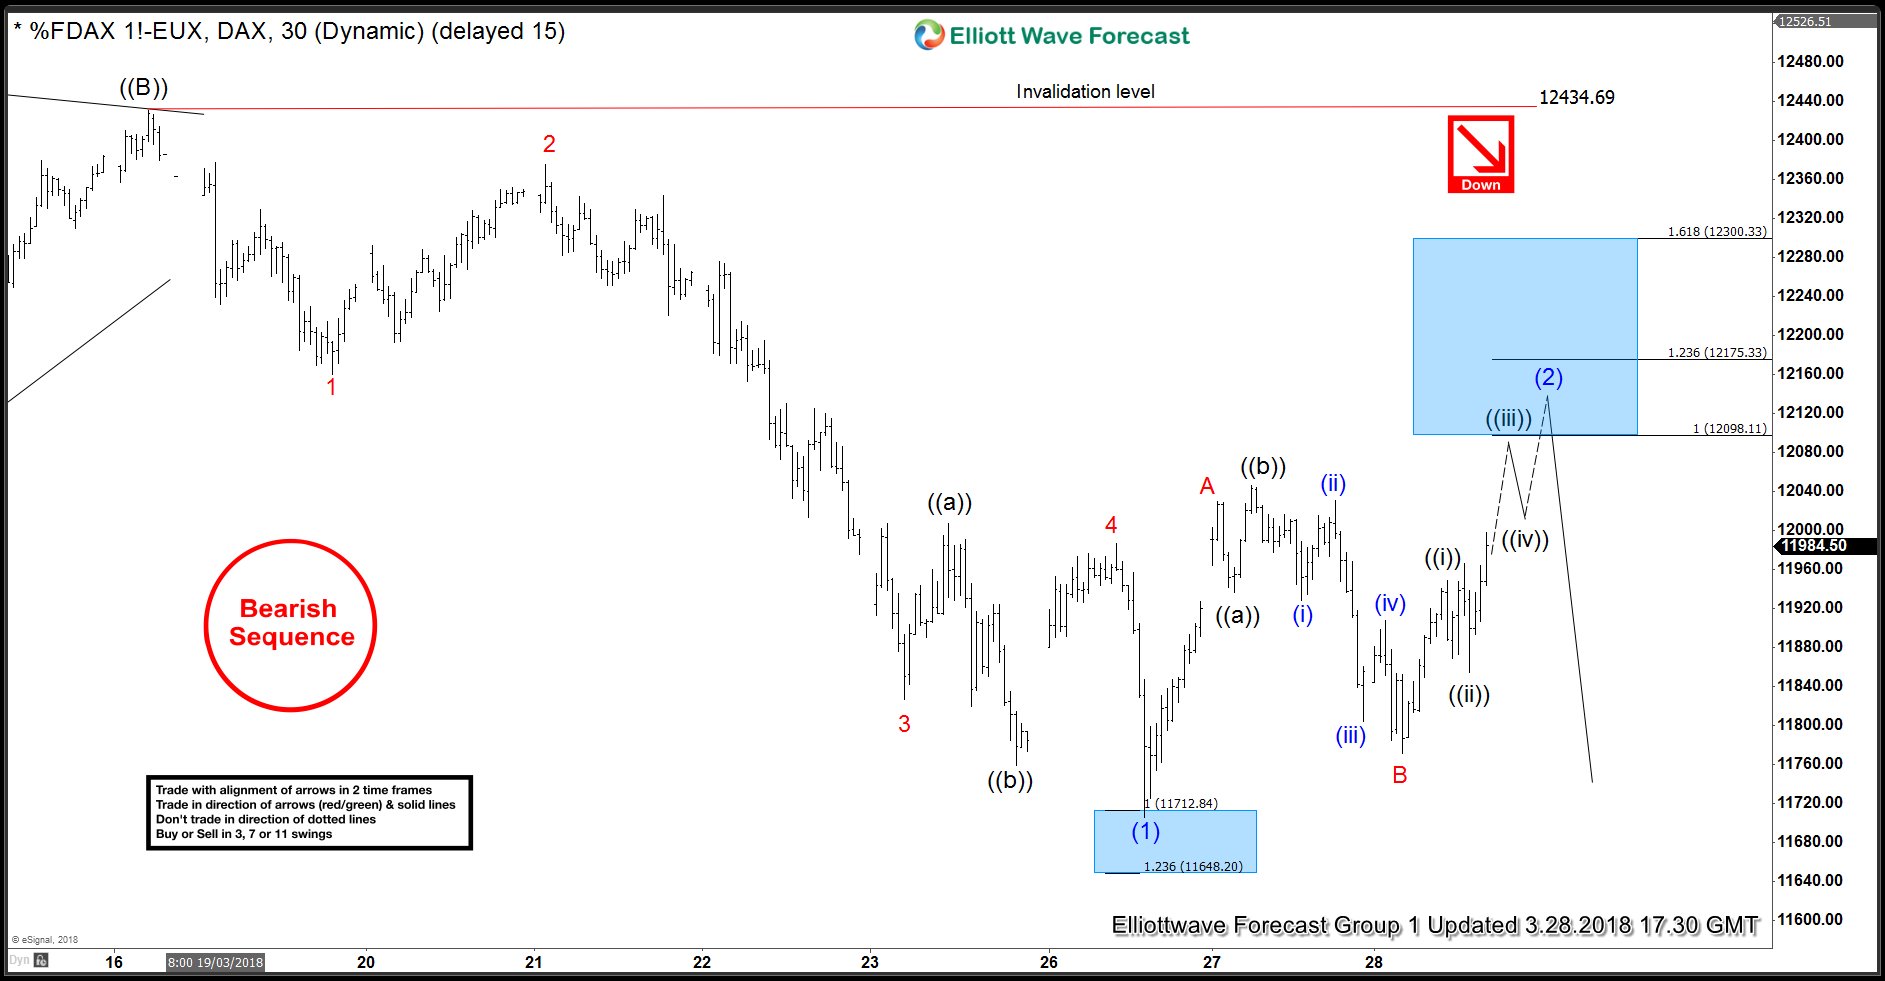
DAX Elliott Wave Analysis 3.28.2018 Update
We can see that DAX pull back so far has held above 11706.50 and Index has started pushing higher again. We are calling wave B pull back completed at 11771.50 and are expecting the Index to trade higher in wave C towards 12098.11 – 12300.33 area to complete wave (2). This is the next selling area in the Index and would either result in a wave (3) decline to new lows below 11706.50 or produce a 3 waves reaction lower at least to allow the shorts to get into a risk free position. As Index is in a corrective wave (2) bounce and has a bearish sequence with dotted lines going higher, we don’t like buying the Index in proposed push higher and expect sellers to appear in 12098.11 – 12300.33 area for a 3 waves reaction lower at minimum.
Back


