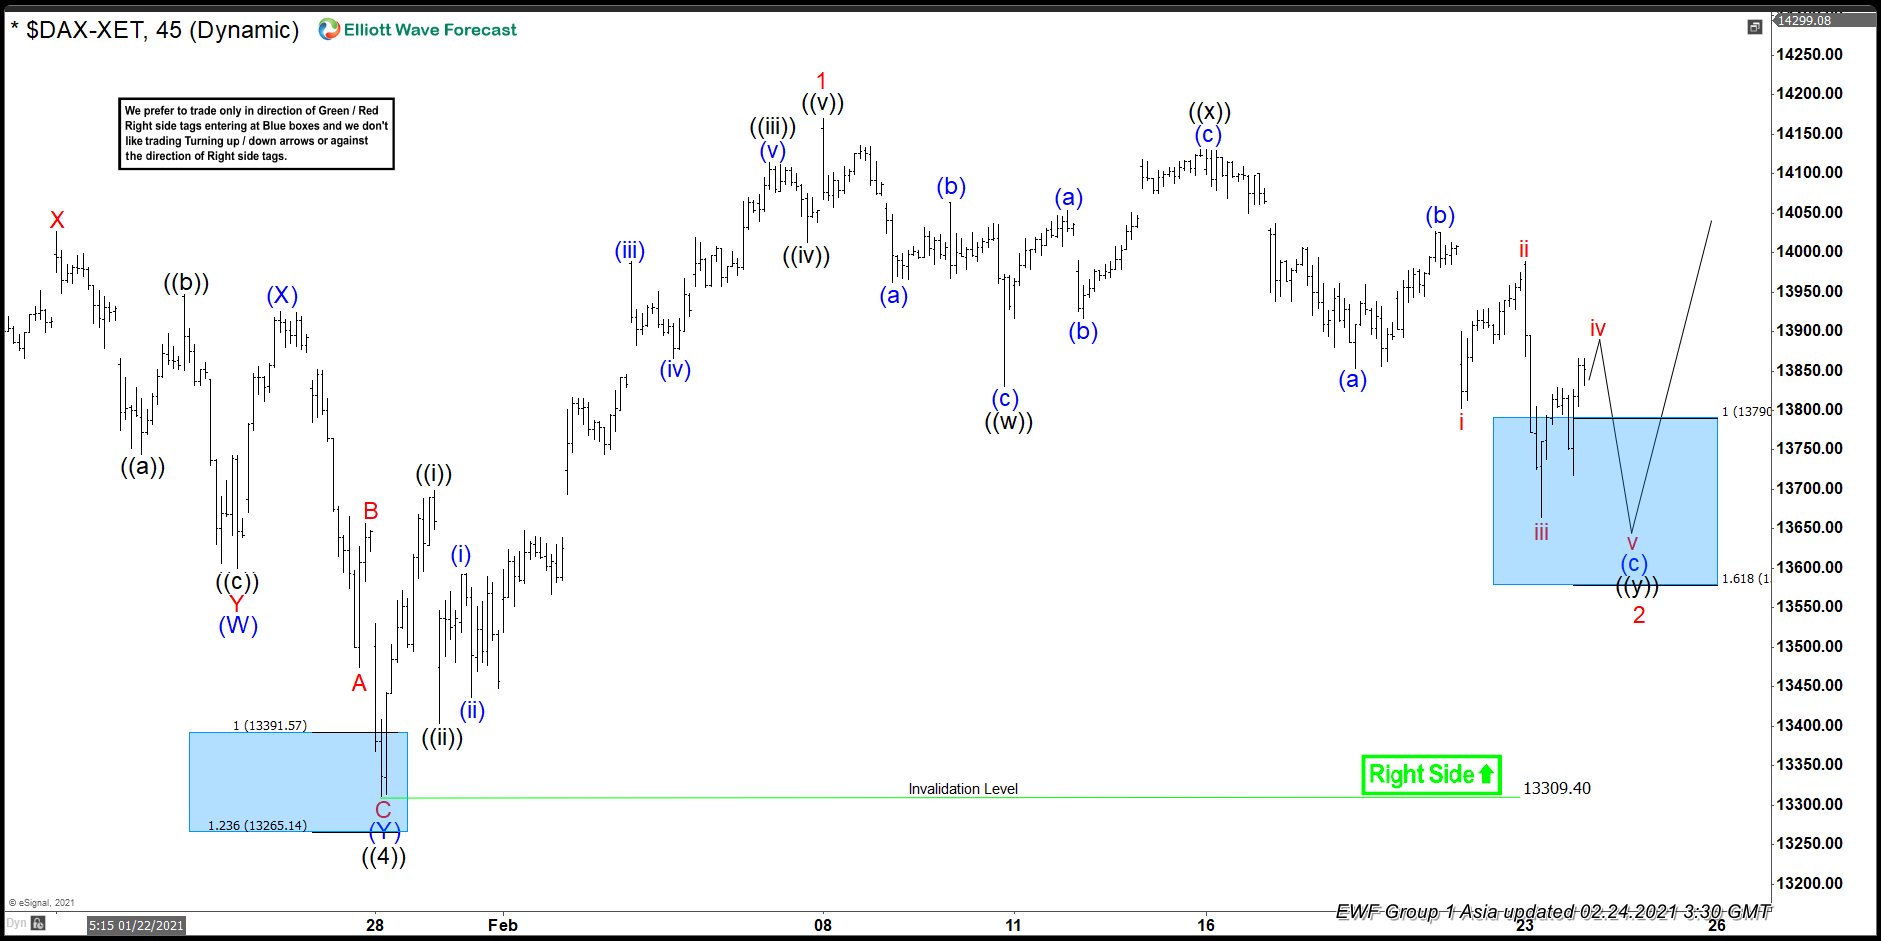
In this blog, we are going to take a look at the DAX index. The short term Elliott Wave view on the index shows a correction in ((4)) at 13310.95 on February 28, 2020. Internally, we have wave (W) at 13599.78. A rally followed in (X) at 13925.73. Wave (Y) followed lower and completed the sequence in ((4)) at 13309.40. This was in the blue box where (Y) was projected between 100% (13391.57) and 123.6% (13265.14) of (W). Internal subdivision blue (W) was a double three . On the other hand, internal subdivision of blue (Y) was zig zag , making an interesting variation within the correction in ((4)).
Up from the February 28 lows, we saw a 5 wave Elliot Wave impulse in 1. We saw a pullback in wave 2, which we expected to unfold in three swings. In the chart below, price was within the blue box where we expected a reaction higher.
DAX 1 hour Elliott Wave chart 2/24/2021
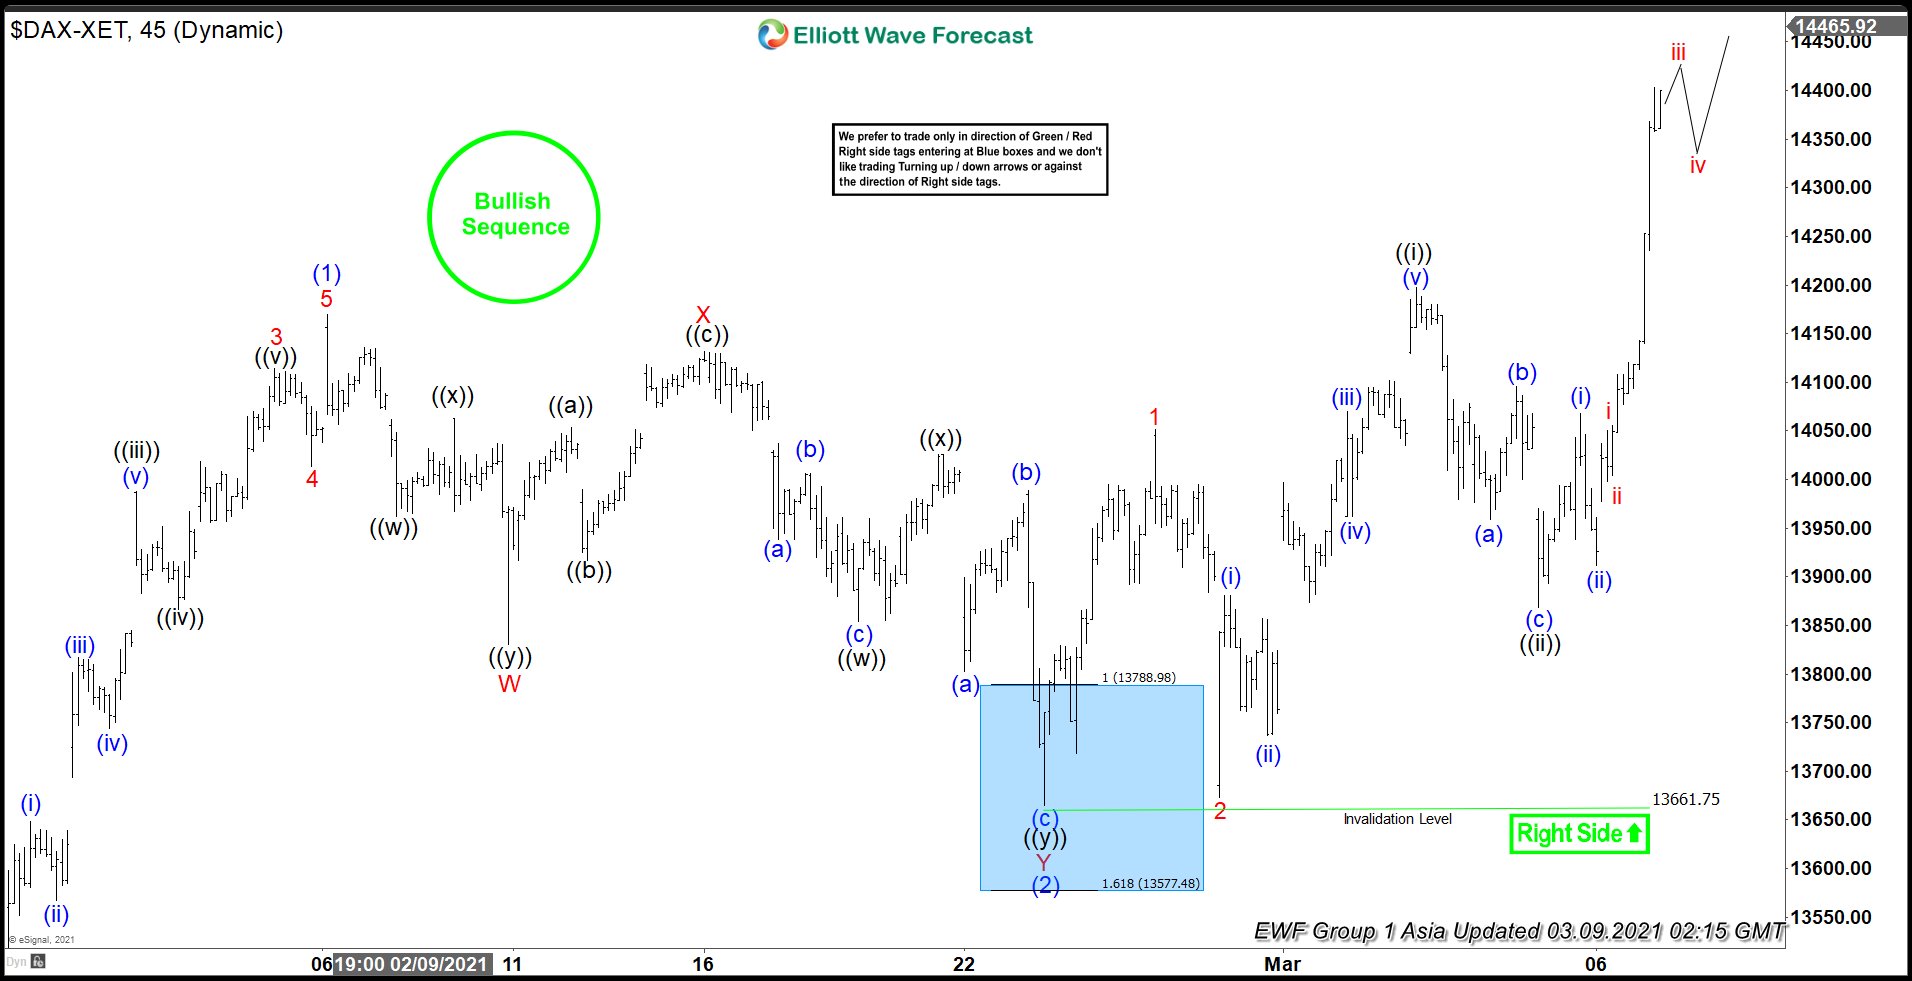
We saw a reaction higher from the blue box at 13661.75 as shown in the image below. Index indeed broke higher above the end of the recent cycle peak of 14169.49. This break confirmed the next leg higher as it ruled out possibility of a double correction below the 14169.49 peak. While index is above 13661.75, we expect it to accelerate higher in ((5). However, we do not expect a straight line move in up in ((5)). This is a result of the nature of the market moves which are not linear.
DAX 1 hour Elliott Wave chart 3/9/2021
 During our live trading room session, we bought at the blue box and the position is running risk free. We prefer to buy future short term dips in this instrument in 3,7 or 11 swings since the right side is upside. In addition, we also have a bullish sequence as shown on the 1 hourly chart above. To learn more about blue boxes, and much more,please clicke for a 14 Day Free Trial!!!


