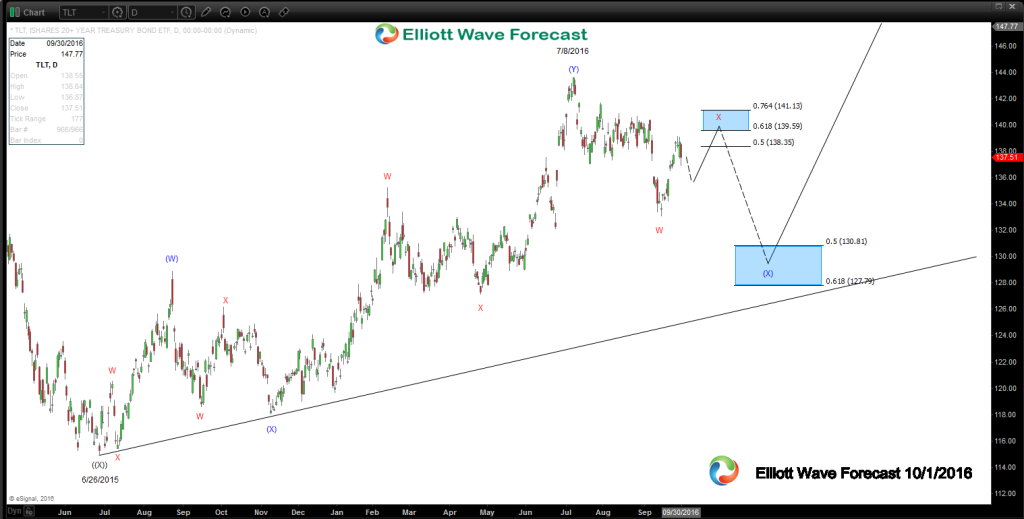
It has been a while since writing an Elliott Wave analysis piece on this instrument and I would like to start by mentioning this view from October 2015 here . Notice the date 6/26/2015 and lows at 114.88 which is shown there as a blue wave (X) . This current analysis shown below at the lower part of the page references this low as one degree larger ((X)) at the 6/26/2015 lows since subsequent price analysis suggests it is of one larger degree. Other than that the price action since the previous article has for the most part unfolded as described and more specifically now it appears to be unfolding as a triple three Elliott Wave structure.
Nearer term at this juncture if the 133.03 wave W lows from 9/15/2016 hold during the current dip, another swing higher in the wave X correction is favored to be seen and for that to remain below the 143.62 wave (Y) high from 7/8/2016 for another swing lower toward 130.81-127.79 area in the 2nd wave (X) that is correcting the Elliott Wave cycle up from the previous (X) lows from 11/9/2015. While that low and the more important larger degree lows from 6/26/2015 show they will remain intact with our distribution and pivot system that shows us the all important trend, we will expect to see another swing higher again in TLT prices while yields continue their sideways to lower price movement. As previously mentioned as long as the trend remains up price can go toward the 150 area in the next swing higher with an exact extension area target for wave (Z) pending until the dip in the 2nd (X) completes to be able to get the wave (Z) equal to and 1.236 extension area of it’s relationship to (W)
Thanks for looking and visiting the website. If you like take a free trial subscription and see if we can be of help in your trading. Kind regards & good luck trading.
Lewis Jones of the elliottwave-forecast.com Team
Back

