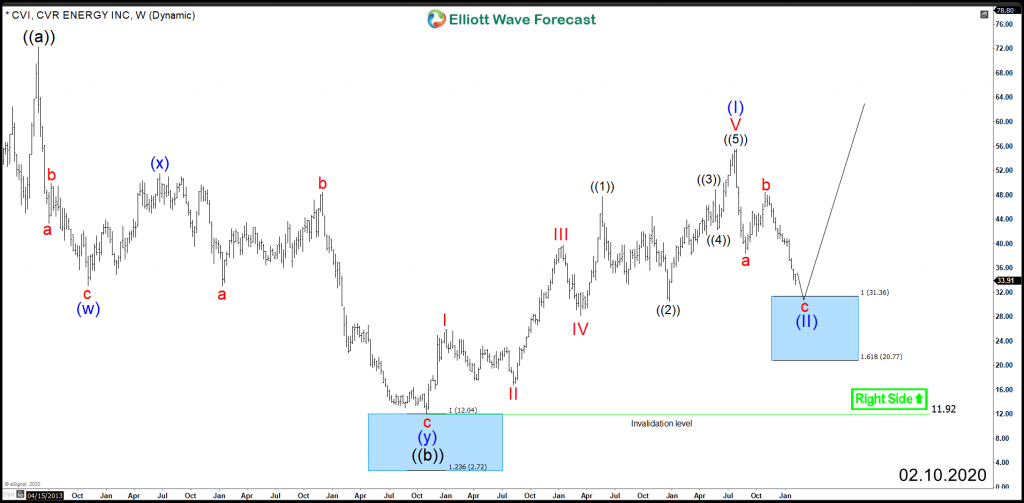
CVR Energy (NYSE:CVI) lost almost 40% of it’s value since July of last year, as the stock started correcting the impulsive 5 waves advance from 2016 low.
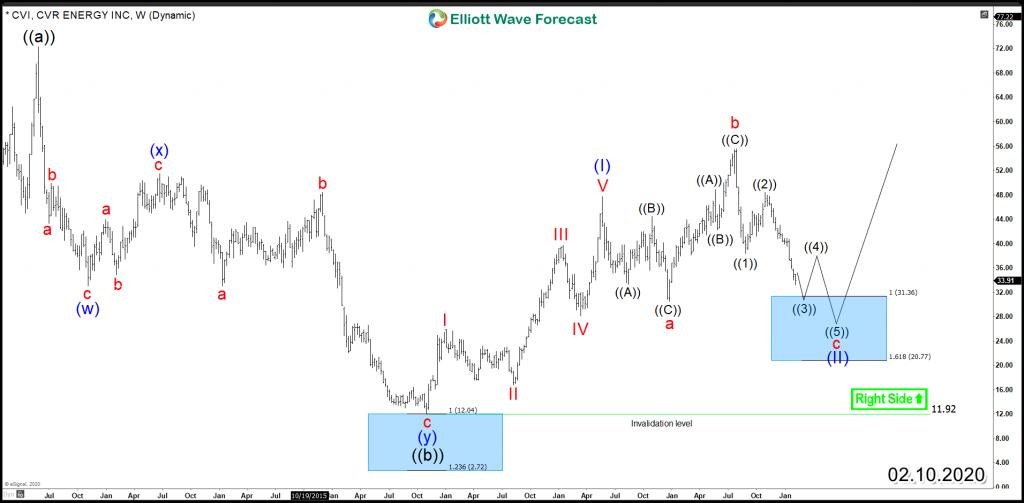
The correction taking place is unfolding as 3 waves Zigzag structure which can ideally find support at equal legs area $31.36 – $20.77 from where a reaction higher is expected to take place. However if the bounce fail and another leg lower takes place then the move could turns out to be a corrective Flat structure and the decline from 2019 peak is a wave ” c “.
In both scenarios, CVI is expected to end the correction and find support for the coming few months as a bounce is expected to take place in #energy sector based on correlation with related instruments like Chevron , EQT Corporation and Crude Oil .
CVI Weekly Chart
CVI Flat Scenario
The presented blue box in the above charts is a High-frequency area where the Market is likely to end cycle and make a at least a 3 waves bounce to allow investors to create a risk free position. Consequently, until the stock manage to break above July 2019 peak, it can still do a 7 or 11 swings correction lower before ending wave (II).
Get our latest updates about Energy Sector by taking this opportunity to try our services 14 days for Free and learn how to trade Stocks and ETFs using our blue boxes and the 3, 7 or 11 swings sequence. You will get access to our 78 instruments updated in 4 different time frames, Live Trading & Analysis Session done by our Expert Analysts every day, 24-hour chat room support and much more.
Back


