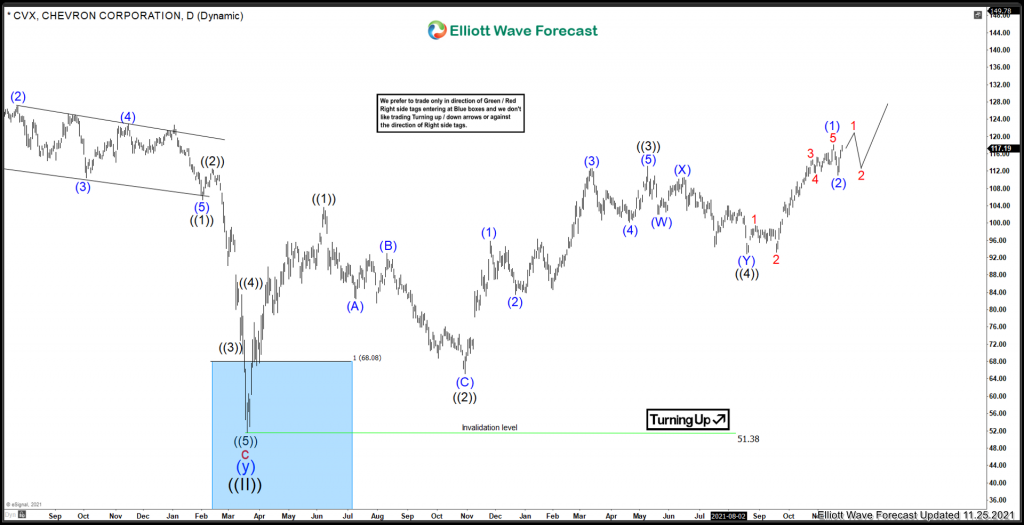
The last time I covered Chevron was back in November 2021. And I was expecting a larger cycle to complete before pulling back against March 2020 low. Lets take a look at the view I was presenting back then and compare to what the market gave us.
Chevron Elliottwave View November 2021:
At the time, with the evidence the market was presenting, the wave count was still looking for more upside. Black ((5)) was favoured to be underway, and Red I would peak, with a pullback in Red II Against the March 2020 low. The Energy Sector has been bullish ever since the March 2020 low was struck. And the momentum continues to favour the upside. Lets take a look at the current analysis the market is presenting.=
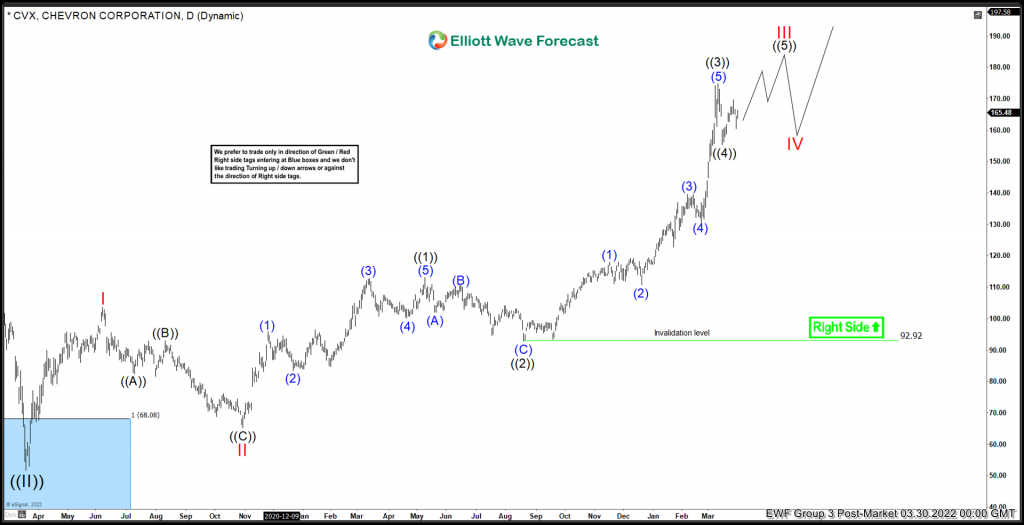
Chevron Elliottwave View March 2022:
Since the August 2021 low, The market was nesting for higher extension, rather than preparing to pullback. We have been warning members all year to avoid getting bearish on the commodities sector, especially the energy sector. After (2) was set, the market broke higher in momentum into a wave 3 of 3. The peak in momementum came at the (5) of ((3)) peak on March 10th. After that, a pullback has taken place in ((4)). Right now, further extension higher is still favoured to take place within ((5)) of Red III. The next area on the upside where another pullback in IV can take place is the 179.55 to 187.03 area. We do not like to sell it, we prefer to look for pullbacks in 3, 7 or 11 swing to blue boxes where buyers can enter for a bounce in 3 swing at least.
Risk Management
Using proper risk management is absolutely essential when trading or investing in a volatile stocks. Elliott Wave counts can evolve quickly, be sure to have your stops in and define your risk when trading.
Improve your trading success and master Elliott Wave like a pro with our 14 day trial today. Get free Elliott Wave Analysis on over 70 instruments. Including stocks like GOOGL, TSLA, AAPL, FB, MSFT and many many more.
Back


