Good day Traders and Investors. In today’s article, we will look at the past performance of Caterpillar Inc. ($CAT). In our last article we explained that the stock has reached the Blue Box area where a bounce can happen. This is how we saw it back in Sep 2022.
Caterpillar ($CAT) ElliottWave October 2022 View (Weekly):
Since Sep 2022 forecast, $CAT has managed to break below 07/11/2022 low in 3 swings at ((B)) with RSI divergence. It then found a bottom on 09.26.2022 and rallied impulsively. It is favoured to be correcting the cycle against May 2021 peak in an expanded flat structure and sellers should appear soon once the ((C)) has completed. Flats are tricky and they tend to trap many traders into thinking that the reaction is impulsive which can give the impression that a new trend is unfolding. The only way to confirm that the Bottom is in on $CAT is for the stock to break the all time highs at $246.69.
We at Elliottwave forecast have developed a system to improve the reliability of the forecast and keep us ahead by using Market correlation, cycles, swing sequence, and distribution system and that system is telling us that $CAT is not done to the downside.
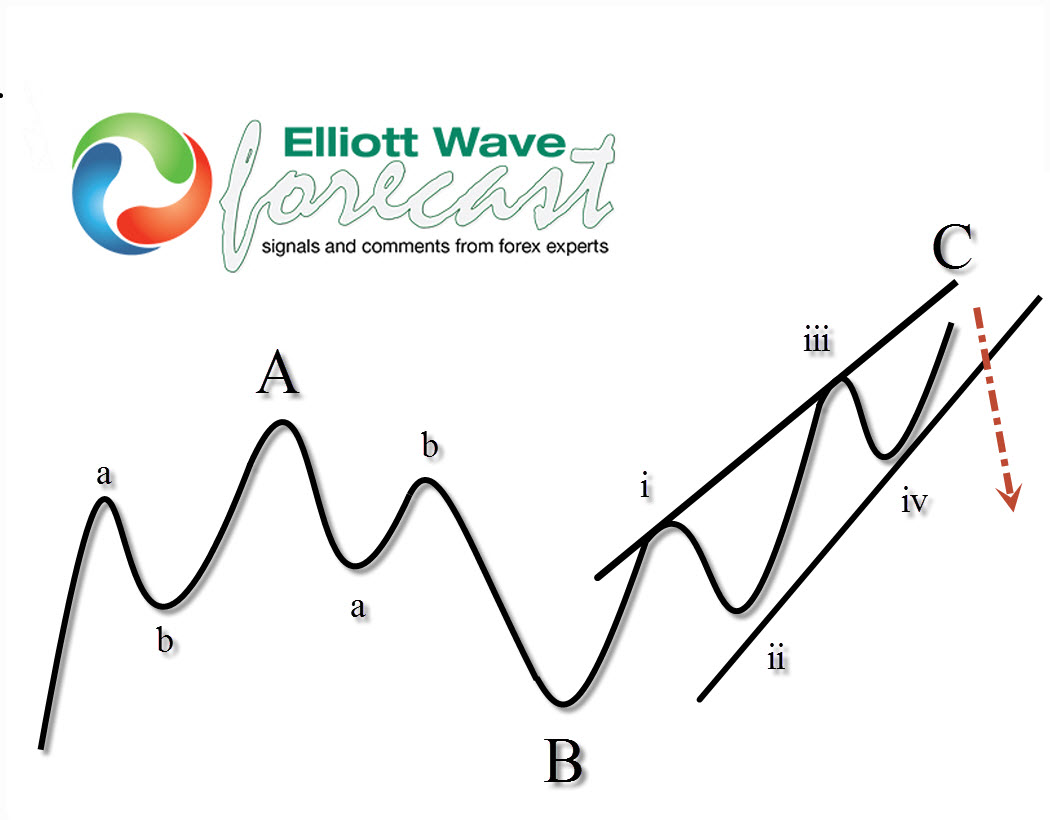
Expanded Flat Structure:
Here is the idea of how the expanded flat structure looks like.
Elliott Wave Forecast
We cover 78 instruments, but not every chart is a trading recommendation. We present Official Trading Recommendations in the Live Trading Room. If not a member yet, Sign Up for Free 14 days Trial now and get access to new trading opportunities.
Welcome to Elliott Wave Forecast!
Back


