The social networking service Twitter (NYSE:TWTR), is one of the fewest technology companies that went public and its stock under-performed among the sector against the giants of the game.
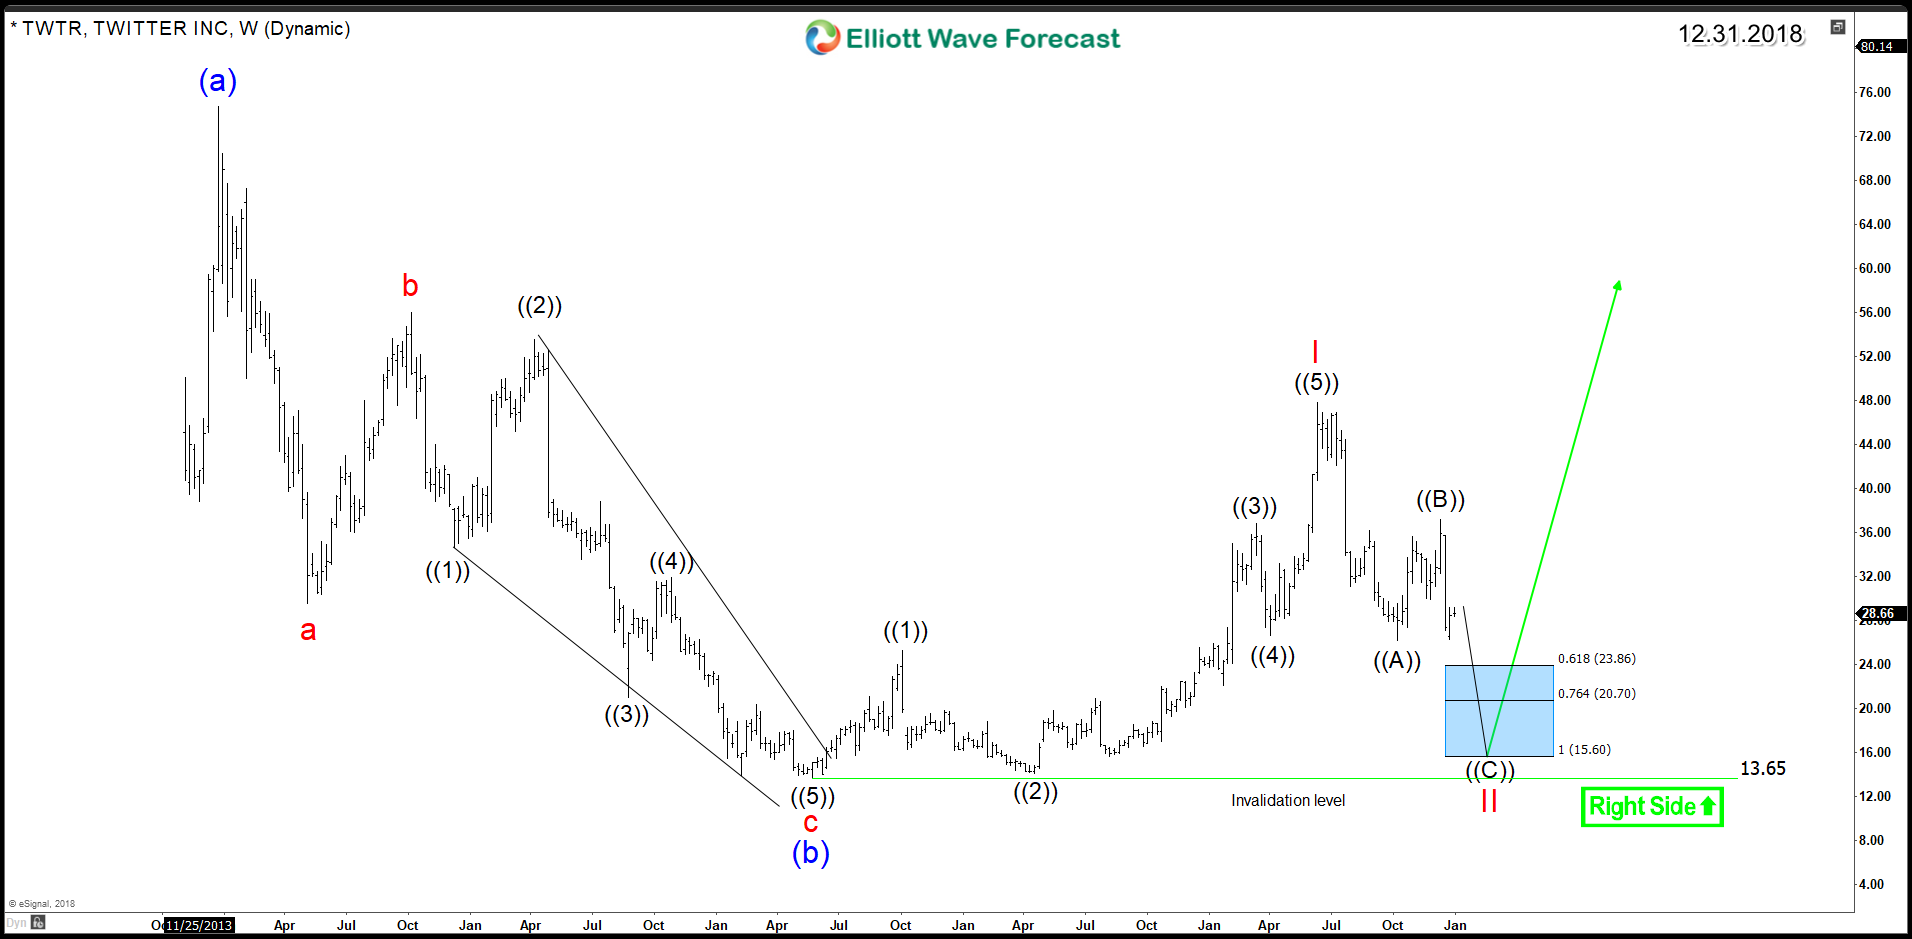
After its IPO in 2013, TWTR rallied to $74 and since then it started a correction lower with a 3 waves decline as a zigzag structure that ended in 2016 at $13.6 low. Up from there, the stock rallied higher showing an impulsive 5 waves advance toward $47 then it started another technical correction lower. The decline from June 2018 peak can be looking for the extreme area around $23.8 – $15.6 before finding buyers to resume the rally higher or bounce in 3 waves at least.
Twitter TWTR Weekly Chart 12.31.2018
Based on the Elliott Wave Theory, a 5 waves move is followed by a 3 waves correction then the trend resume with another 5 waves in the same previous direction. Consequently, as long as TWTR remain above $13.6 low, then the stock can rally higher to break 2018 peak with another 5 waves move which can be a part of a new impulsive cycle to the upside to take the stock to new all time highs.
However until the stock manage to creates extension higher with a break above 2013 peak, the next 5 waves move could remain just a wave c of a 3 waves zigzag structure which would end below 2013 peak then another leg lower will take place.
Forecasting is a process of continuous adjustments. A waver needs to accept when an idea doesn’t work out and adjust according to new data without a bias. Therefore, Twitter can present a good investing opportunity for the coming 2 years then the whole idea can change with the new structure.
Get more insights about Technology Stocks by trying out our services 14 days . You’ll learn how to trade our blue boxes using the 3, 7 or 11 swings sequence. You will get access to our 78 instruments updated in 4 different time frames, Live Trading & Analysis Session done by our Expert Analysts every day, 24-hour chat room support and much more.
Back

