The Bovespa Index Long Term Bullish Trend and Cycles
The Bovespa Index has been trending higher with other world indices. Since inception the cycles have shown a bullish trend. In early years not seen on this chart it rallied with other world indices trending higher into the May 2008 highs. It then corrected the whole bullish cycle from the beginning. That was while most other world indices were in a pullback lower. The index ended that larger degree correction in October 2008. At this point is where the index corrected the whole decades long bullish cycle. Thus the October 2008 lows is from where this bullish cycle and swing analysis will begin.
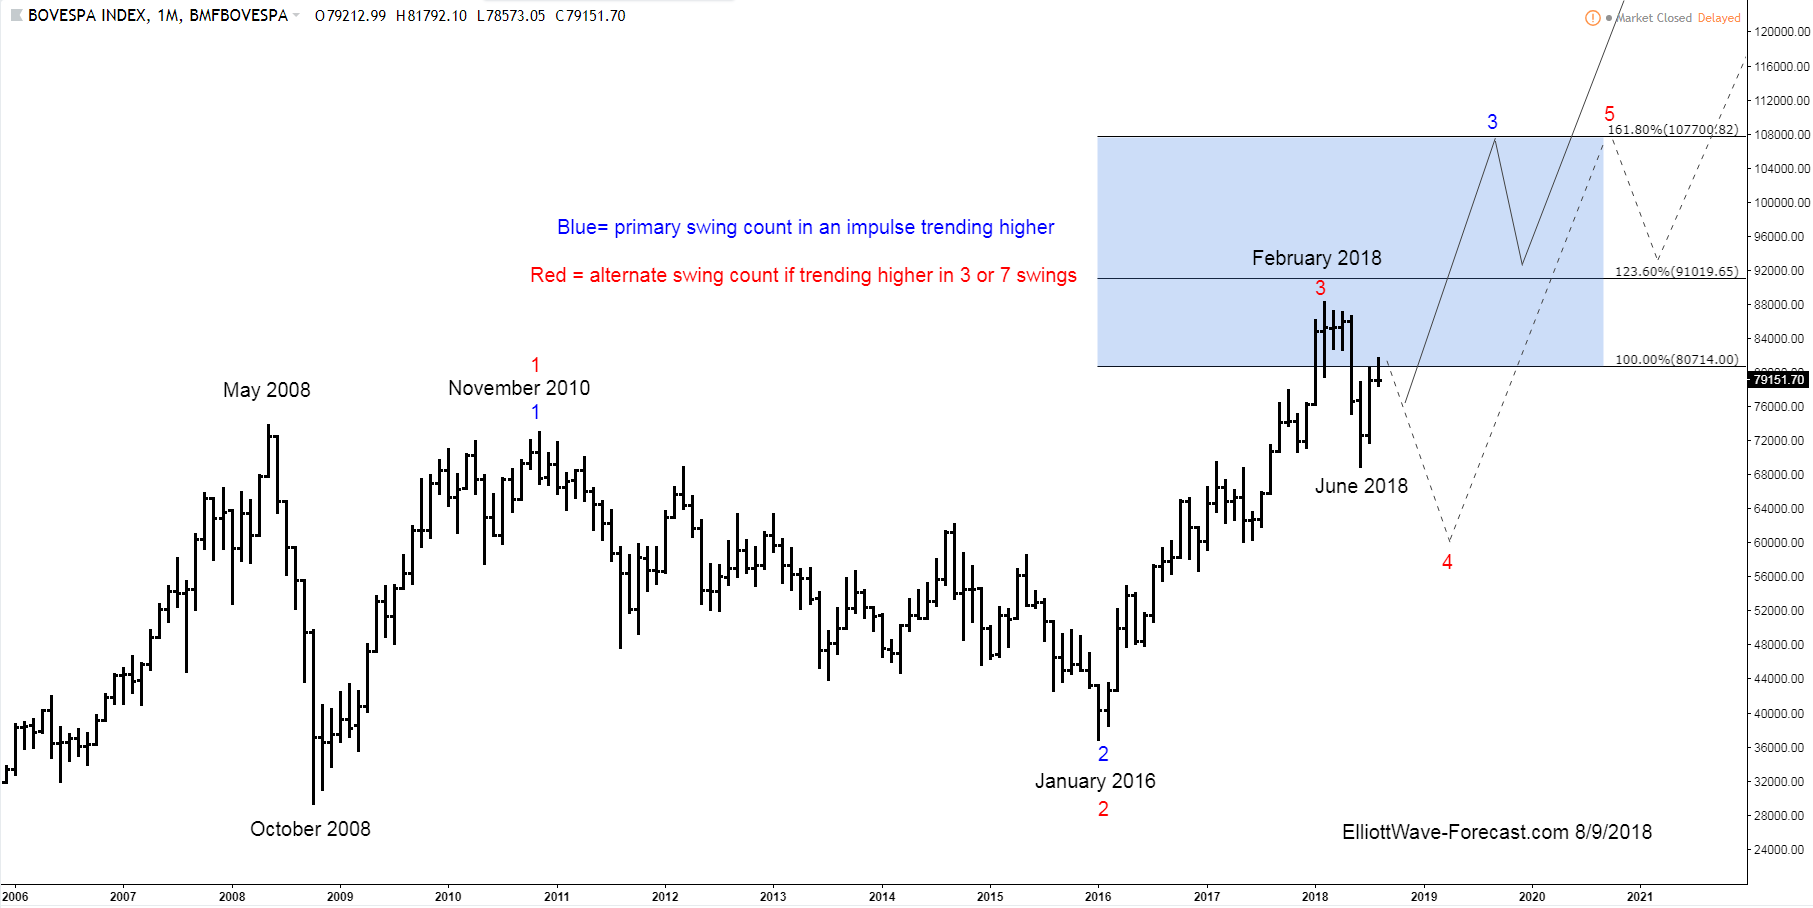
First from the October 2008 lows the index rose into the November 2010 highs in what appears as an impulse. From there the index endured an almost 6 year long correction of that cycle into the January 2016 lows. That pullback can be counted in Elliott Wave several different ways but is irrelevant because since has made new highs. This high in February 2018 is where the alternative swing count high is labeled with the red 3. The favored more bullish swing count suggests the June 2018 lows will remain intact during intermediate term pullbacks.
The analysis continues below the chart.
Secondly I want mention some rules we follow that suggest why I think the index can continue higher toward 107700 while it is above the June 2018 lows. As it relates to Elliott Wave I look at the June 2016 lows as a wave two of the cycle up from the January 2016 lows. You will see the dip into the June 2018 lows remained above the 50% Fibonacci retracement of that cycle. For that reason I presume it is a wave four of that cycle. We also follow a rule that suggests a wave three will be Fibonacci extension 161.8% or more of the preceding wave one. That is why I suggest it will reach 107700 area in the preferred blue 3 before a relatively shallow pullback. It should continue higher again in the fifth wave.
Thirdly and in conclusion. I would like to mention a rule we follow in the alternative swing count. When a market move in 3-7 or 11 swings it usually ends up near the 100% equal legs to 123.6% Fibonacci extension area. If it gets below the June 2018 lows it will end up ending the whole cycle from January 2016. Impulses in 5-9 & 13 swings end up ending cycles near the 161.8 Fibonacci extension. There should be a bullish outcome in the index either way. The aforementioned preferred blue labeled swing count should prevail while above the the June 2018 lows. If it gets below the June 2018 lows it can see a 50% or so Fibonacci retracement of the cycle up from the January 2016 lows before a turn back higher in the red swing 5.
Thanks for looking. Feel free to come visit our website and check out our services Free for 14 days to see if we can be of help.
Kind regards & good luck trading.
Lewis Jones of the ElliottWave-Forecast.com Team
Back

