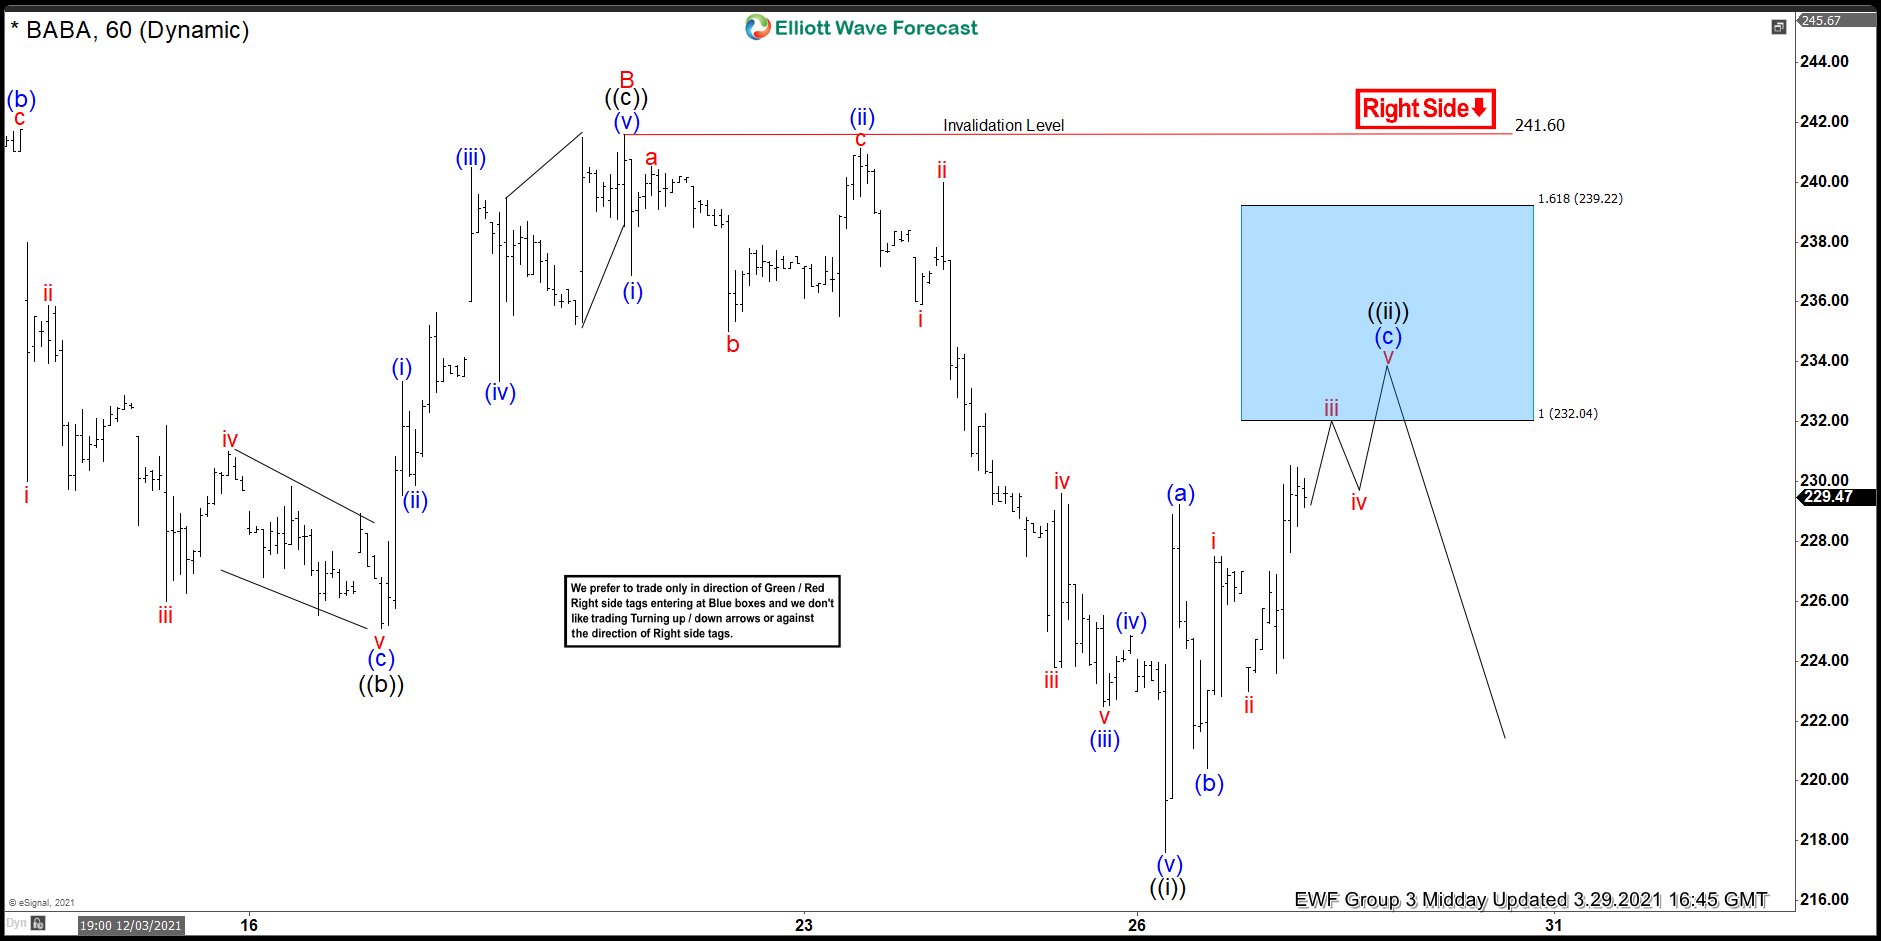
In this blog, we take a look at BABA’s almost perfect reaction lower from the recent blue box. Let us take a look at the 1 hour chart from 3/29/2021. BABA ended a cycle correction at 241.60 peak for red wave B. Down from there, the stock made a five wave impulse decline in black wave ((i)) at 217.61. Internally, we had blue waves (i) to (v) in ((i)). And each of the waves (i) to (v) also subdivided into impulse waves. Blue wave (iii) was in excess of 261.8% extension of blue wave (i) related to wave (ii). Therefore, wave (iii) was extended.
We naturally expect black wave ((ii)) to correct the impulse in ((i)). Up from the 217.61 black wave ((i)) lows, we see 3 swings in ((ii)). We expected black wave ((ii)) to reach the blue box and turn lower.
Elliott Wave 1 hour chart 3/29/2021 Midday Update
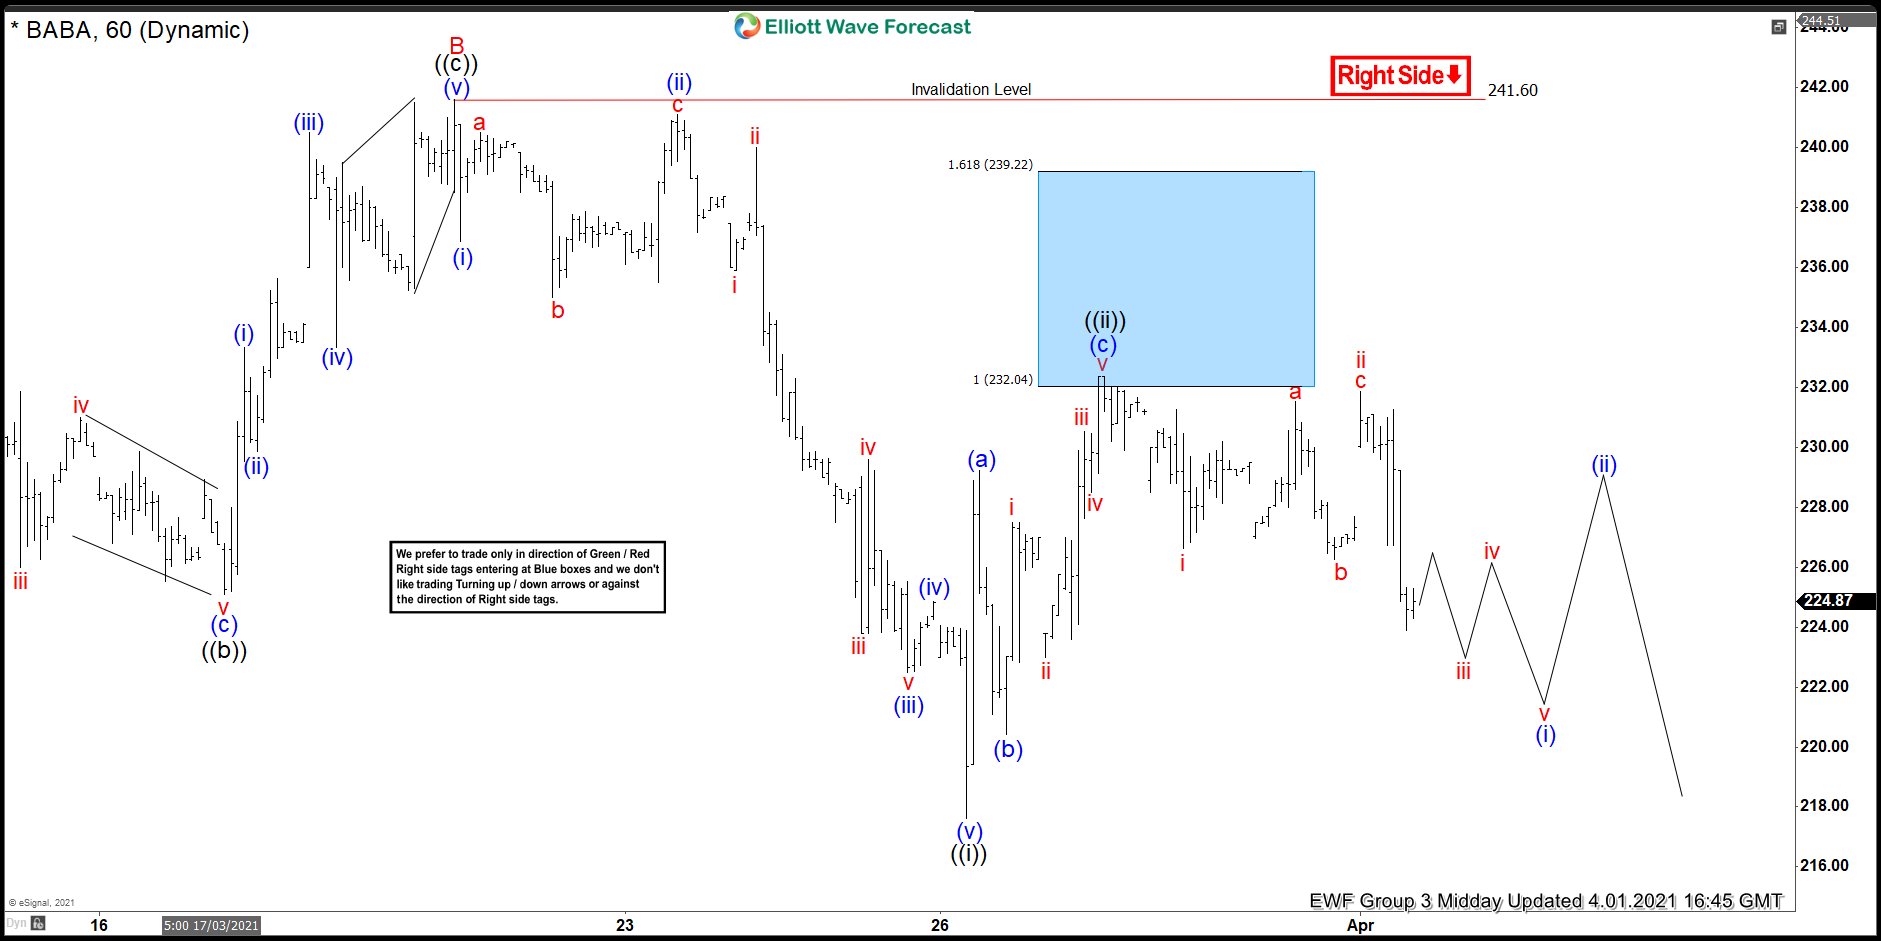
The 1 hour chart below is from 4/1/2021. On it, we see a reaction from the blue box. Short positions from the blue box were already running risk free. We expect BABA to continue lower. We expect the stock to break below 217.61 black wave ((i)) levels in order to confirm the next leg lower in black ((iii)). Our initial target is at least the length for ((iii)) to reach the 100% equal legs of wave ((i)). Since we are anticipating wave ((iii)), we would typically expect an extension to occur. However, wave ((i)) appears to have extended. Therefore, we may not see an extention in wave ((iii)).
Elliott Wave 1 hour chart 4/1/2021 Midday Update
We offer analysis on 78 different instruments across the market. We also offer daily live analysis and live trading room sessions for three different groups. Updates on these instruments are provided regularly on each trading day, and on weekend days. Join us on a 14 Day Trial today, for FREE!!
Back
