Another day, another meme stock rallies. This week, Bakkt is the company I want to focus on. This is another Crypto focussed stock. However, it has a large deal behind it, being a Mastercard deal whereby Bakkt assists mastercard with its users to pay in crypto. Lets take a look at the company profile:
“Our vision is to connect the digital economy We power commerce by enabling consumers, businesses and institutions to unlock value from digital assets. Digital assets – which include cryptocurrency, loyalty and rewards points, gift cards, in-game assets, and non-fungible tokens, or NFTs, which are unique digital assets that are not interchangeable – comprise a growing $1.6 trillion marketplace. We are unlocking new ways to participate in the digital economy for consumers, enterprises, and financial institutions. We accomplish this by expanding access to and improving liquidity for digital assets. Bakkt is positioned at the center of this digital asset ecosystem, with over 500,000 early-access participating consumers, access to 250 merchant partners and nearly 100 institutional clients.”
Recently, as mentioned, it has signed a contract with Mastercard which is a fairly big deal. Lets take a look at the shorter cycles. I will be using a 30 minute charts in this blog, it is important to realize that this stock is heavily volatile. The shorter the timeframe for analyzing, the less reliable the analysis can become. Since the all time lows are in late October 2021, we only have a few sessions to compile a chart.
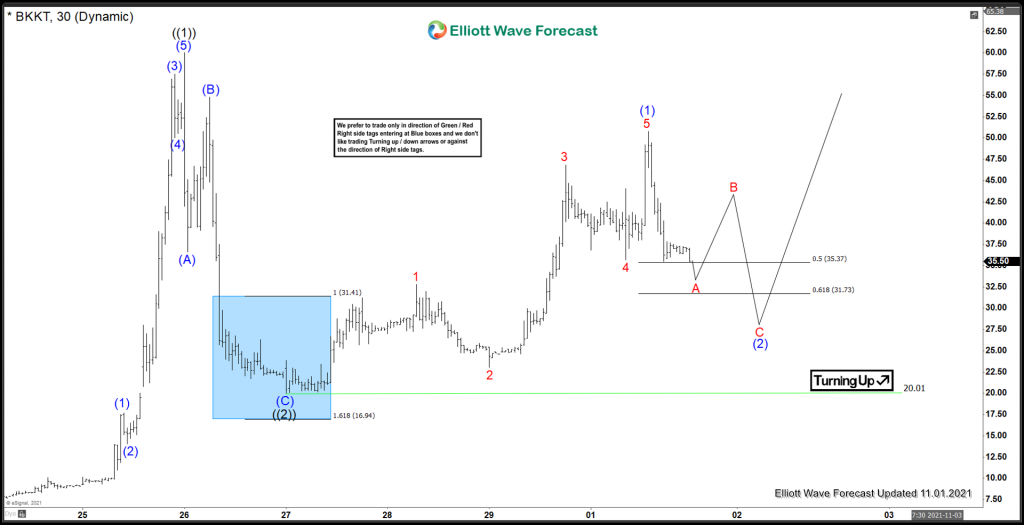
Bakkt Elliottwave View 30m:
Medium term term view from the October 2021 @ 7.63. The stock in essance, has had a sharp surge from that low. The structure comes in 5 waves, with momentum divergence at the peak confirming the impulse higher into ((1)). After that, a sharp pullback took place in 3 waves, which found support in the blue box area. The blue box is an area where algos are programmed to react. In this case, the stock halted the decline in 3 waves (which is corrective). After that, another 5 waves higher has taken place into Blue (1). This peak also comes with momentum divergence confirming the idea of an impulse higher.
Currently, prices are correcting the cycle from ((2)) low, in Blue (2). As long as that 20.01 low remains intact, further upside is favoured to take place. Should that low fail, the next level below for support would be the $10.77 area. On the upside, the potential for ((3)) is the 72.23 to 104.54 area, where a larger pullback can take place. Right now prices are in the middle area, but a break of the ((1)) peak will confirm the next leg higher is underway.
Risk Management
Using proper risk management is absolutely essential when trading or investing in a volatile stocks. Elliott Wave counts can evolve quickly, be sure to have your stops in and define your risk when trading.
Improve your trading success and master Elliott Wave like a pro with our 14 day trial today. Get Elliott Wave Analysis on over 70 instruments including GOOGL, TSLA, AAPL, FB, MSFT, GDX and many many more.
Back

