AstraZeneca is a British-Swedish multinational pharmaceutical and biopharmaceutical company. Founded in 1999 and headquartered in Cambridge, UK, it is a merger of the Swedish Astra AB and British Zeneca Group. Astrazeneca is a part of FTSE100 index. Investors can trade it under the ticker $AZN at London Stock Exchange and also under $AZN at NASDAQ. The company has a portfolio of products for such disease areas like cancer, gastrointestinal, cardiovascular, inflammation, respiratory and infection. Besides the engagegement in these areas, in recent weeks Astrazeneca has attracted a strong attention as one of the suppliers of vaccines to fight against COVID-19. Will this involvement promote the stock price to the new highs?
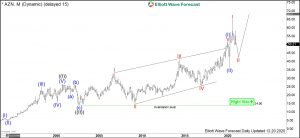
AstraZeneca Monthly Elliott Wave Analysis 12.28.2020
The monthly chart below shows the Astrazeneca stock $AZN traded at Nasdaq. From the all-time lows, the stock price is showing Elliott wave motive wave patterns. Firstly, the cycle up in black wave ((I)) of grand super cycle degree has ended by printing its top in September 2000 at 26.63. After 5 waves higher in ((I)), the correction lower in 3 swings of wave ((II)) lower has ended in September 2002 at 14.00.
Secondly, from the 2002 lows, a new motive cycle higher in black wave ((III)) is in progress. Hereby, the advance towards January 2020 highs at 51.55 is a leading diagonal structure within blue wave (I). To be noted: a sharp pullback of only 2 months towards March 2020 lows in wave (II) has corrected the entire cycle cycle higher of almost 18 years long. As a matter of fact, it has printed an important bottom at 36.15.
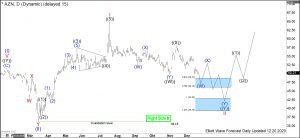
AstraZeneca Daily Elliott Wave Analysis 12.28.2020
The daily chart below shows in more detail the price action from the March 2020 lows at 36.15. First, an impulse within a wave I has ended in July 2002 at 64.94. Hereby, it has broken to the new all-time highs confirming the blue wave (III) to be in progress. From the top, a correction in wave II is unfolding as a double three structure. It should reach lower in 7 swings towards 42.90-39.30 area. From there, wave III of (III) should resume the rally to new highs.
Therefore, the blue box area 42.90-39.30 is a great opportunity to enter the market at a good price. Buyers should be waiting there. From the extremes, the AstraZeneca stock should accelerate in the red wave III towards 64.94 and higher or should bounce in 3 waves at least. The target for blue wave (III) will be 73.74-96.97 area.
Get more insights about Stocks and ETFs by trying out our services 14 days . You’ll learn how to trade the market in the right side using the 3, 7 or 11 swings sequence. You will get access to our 78 instruments updated in 4 different time frames, Live Trading & Analysis Session done by our Expert Analysts every day, 24-hour chat room support and much more.
Back


