Continental is a German multinational automotive parts manufacturing company. It is specializing in brake systems, interior electronics, tachographs, automotive safety, powertrain and chassis components, tires and other parts for the automotive and transportation industries. Founded in 1871 and headquartered in Hanover, Germany, Continental is a part of DAX30 index. From the all-time lows, the stock price is showing a series of nests. It is expected to accelerate higher towards the new all-time highs.
Continental Monthly Elliott Wave Analysis 01.25.2021
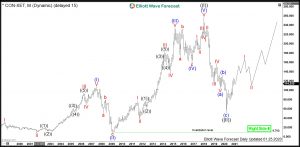
The monthly chart below shows the Coninental stock $CON traded at XETRA. From the all-time lows, Continental has developed a cycle higher in black wave ((I)) of a grand super cycle degree. It has printed the the all-time highs on January 2018 at 257.40. Hereby, within the impulsive advance, all the subwaves (I), (III) and (V) are impulsive waves, too. Wave (III) demonstrates a clear extension in price.
From the January 2018 highs, a sharp correction in wave ((II)) has retraced more than 78.6% of the rise. It has unfolded as an Elliott wave zigzag pattern being 5-3-5 structure. Hereby, it has bottomed in March 2020 at 51.45. From there, the wave ((III)) might be in first stages and should break to the new all-time highs. The target higher for the wave ((III)) is the 1.0-1.618 extension of the wave ((I)) being 309.30-468.61 area and even higher.
Continental Daily Elliott Wave Analysis 01.25.2021
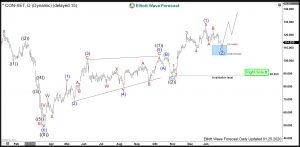
The daily chart below shows the advance higher in red wave I of blue wave (I) of black wave ((III)). First, from the March 2020 lows at 51.45, a cycle higher in black wave ((1)) has unfolded as a leading diagonal. It has printed its top in October 2020 at 103.90. Then, a correction lower in black wave ((2)) has been accomplished on 30th of October at 88.50. From the lows, the wave ((3)) higher has been confirmed by breaking above 103.90 highs. Now, while above 88.50, wave ((3)) should extend further and reach towards 1.0-1.618 extension of the wave ((1)) being 141.07-173.44 and even beyond.
The pullbacks should find support above 88.50 lows. Right now, while below 123.60, $CON can fall lower into 111.86-104.52 blue box extension area where buyers may enter the market for a rally in blue wave (3) or for a bounce in 3 waves at least.
Get more insights about Stocks and ETFs by trying out our services 14 days . You’ll learn how to trade the market in the right side using the 3, 7 or 11 swings sequence. You will get access to our 78 instruments updated in 4 different time frames, Live Trading & Analysis Session done by our Expert Analysts every day, 24-hour chat room support and much more.
Back


