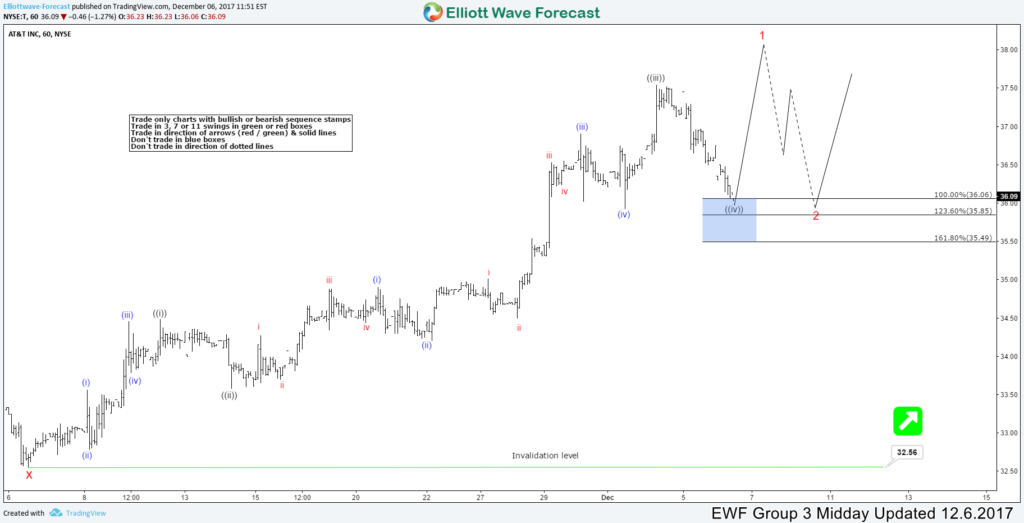
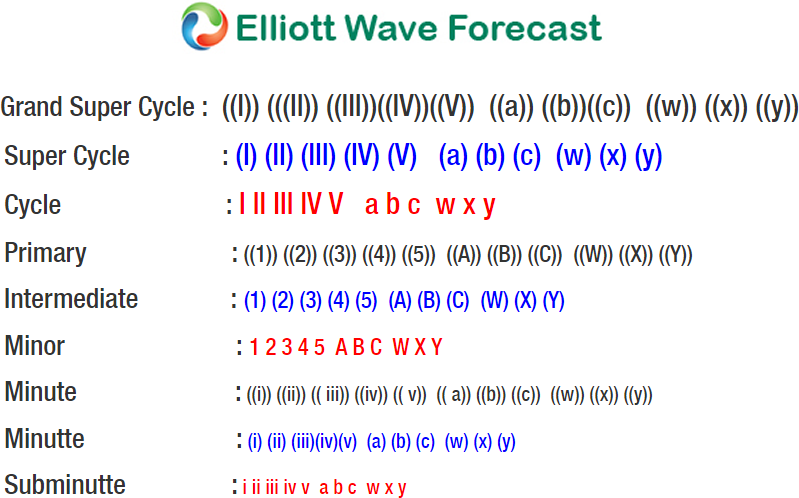
AT&T Short term Elliott Wave view suggests that the decline to November 06 low 32.56 ended Cycle wave X. A rally from there is unfolding as an impulse Elliott Wave structure with extension in 3rd swing higher and each leg has internal oscillations of 5 waves thus favoring it to be an impulse. These possible 5 waves move higher should end Minor wave 1 in an Impulse sequence or a wave C of a FLAT correction from 10/25 low (33.34). In either case, after 5 waves move ends, the stock should pull back in 3 waves at least as the Elliott Wave Theory suggests.
Up from 32.56 low Minute wave ((i)) ended 34.45, Minute wave ((ii)) ended at 33.59 low, Minute wave ((iii)) ended at 37.52 on 12/04 peak. Below from there, Minute wave ((iv)) pullback in progress for the correction of 33.59 cycle towards 36.06-35.49 100%-161.8% Fibonacci retracement area. Then from there, as far as a pivot from 33.59 low stays intact the stock is expected to resume the upside to complete a 5 waves impulse in wave 1. Afterwards, stock should pull back in wave 2 to correct the cycle from 32.56 X low. We don’t like selling it and we expect short-term buyers to appear in 36.06-35.49 area for a 3 wave bounce at least.
AT&T 1 Hour Elliott Wave Chart
Keep in mind that the market is dynamic and the view could change in the meantime. Success in trading requires proper risk and money management as well as an understanding of Elliott Wave theory, cycle analysis, and correlation. We have developed a very good trading strategy that defines the entry. Stop loss and take profit levels with high accuracy and allows you to take a risk-free position, shortly after taking it by protecting your wallet. If you want to learn all about it and become a professional trader, register now for your Free 14 day Trial.
Back


