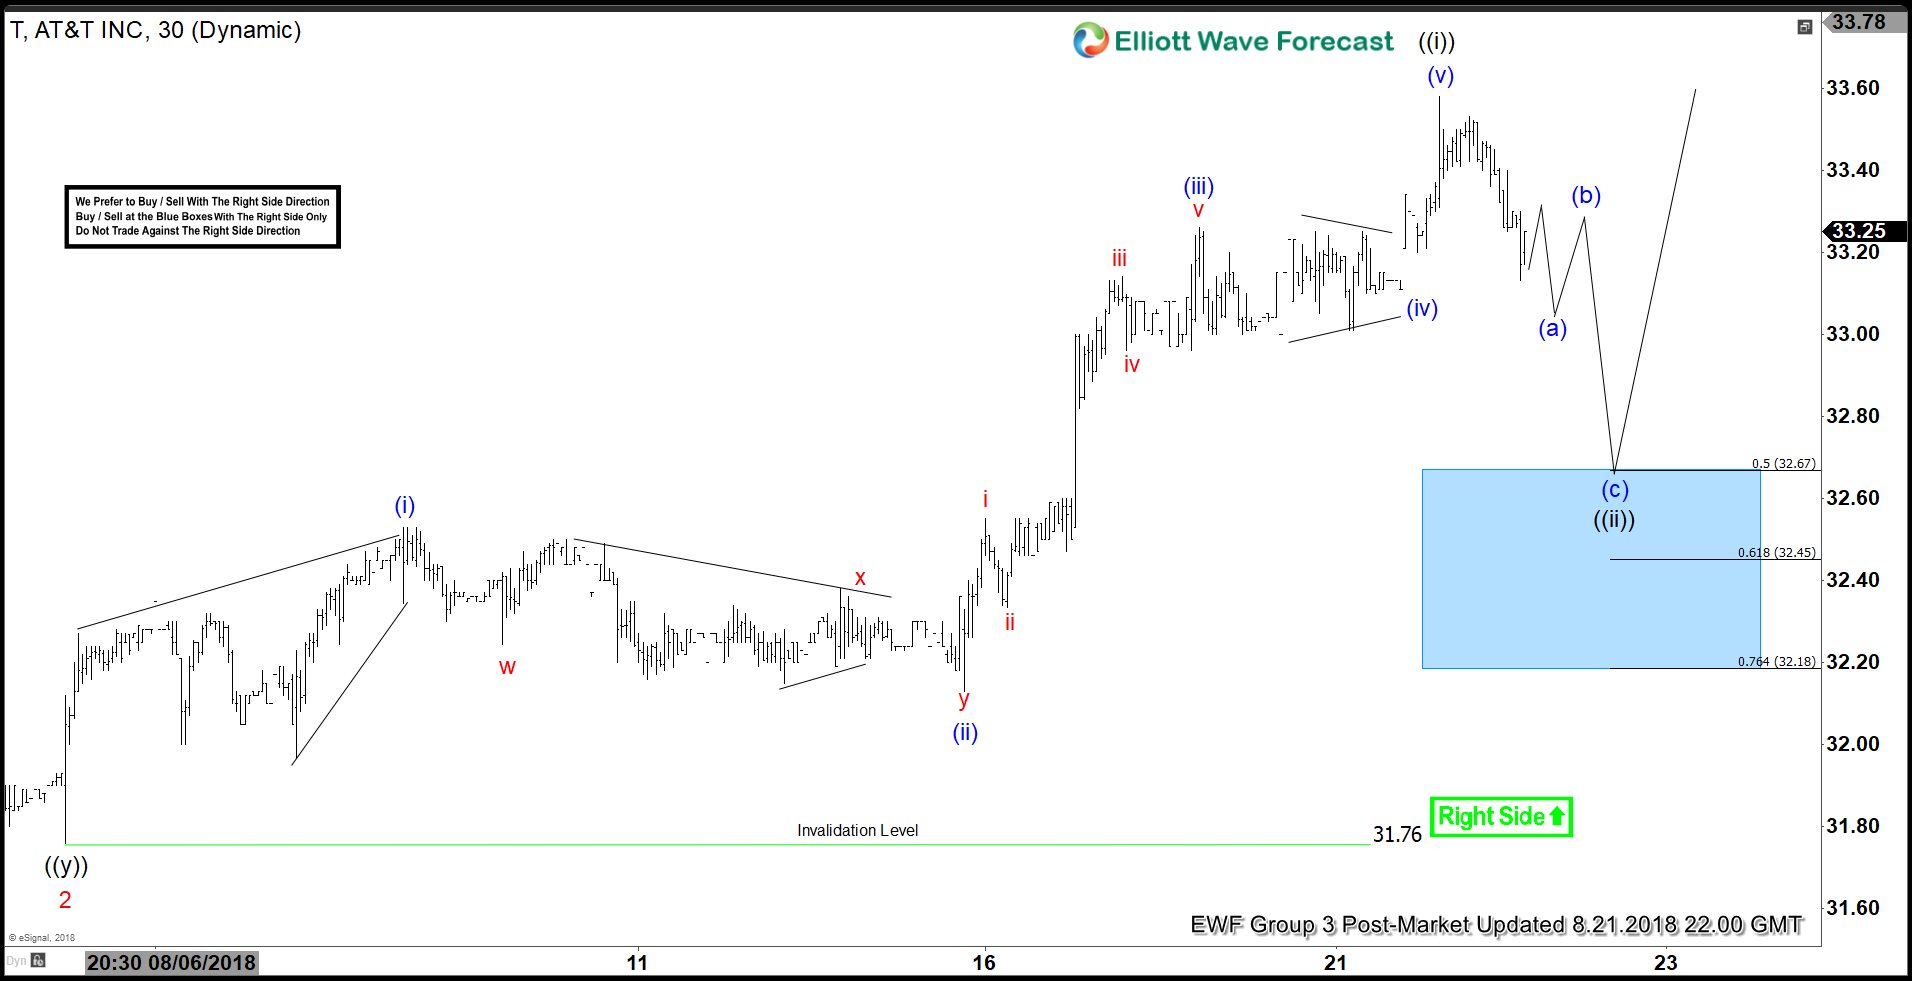
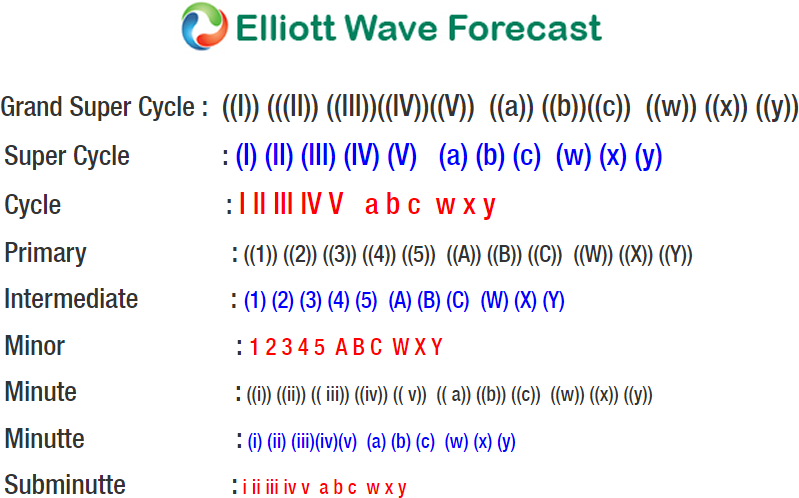
AT&T (ticker symbol T) Short-term Elliott Wave view suggests that the pullback to $31.76 ended Minor wave 2. The stock is rallying from there within Minor wave 3 as an impulse Elliott Wave structure with a nest. An impulse structure subdivides in 5 waves and we can see up from $31.76, the rally to $33.58 ended Minute wave ((i)) of 3.
The subdivision of Minute wave ((i)) is also unfolding as an impulse structure of a lesser Minutte degree. Minutte wave (i) of ((i)) ended at $32.53, pullback to $32.13 ended Minutte wave (ii) of ((i). Minutte wave (iii) of ((i)) ended at $33.26 while Minute wave (iv) of ((i)) completed at $33.11. The last push higher to $33.58 ended Minutte wave (v) of ((i)) and completed cycle from 8/3/2018 low ($31.76).
The stock is currently pulling back in Minute wave ((ii)) to correct cycle from 8/3/2018 low before the rally resumes. The pullback is proposed to be unfolding as zigzag Elliott Wave structure. We don’t like selling the proposed pullback and expect dips to find buyers in 3, 7, or 11 swing as far as pivot at 8/3/2018 low ($31.76) remains intact in the first degree.
AT&T 1 Hour Elliott Wave Chart
Back


