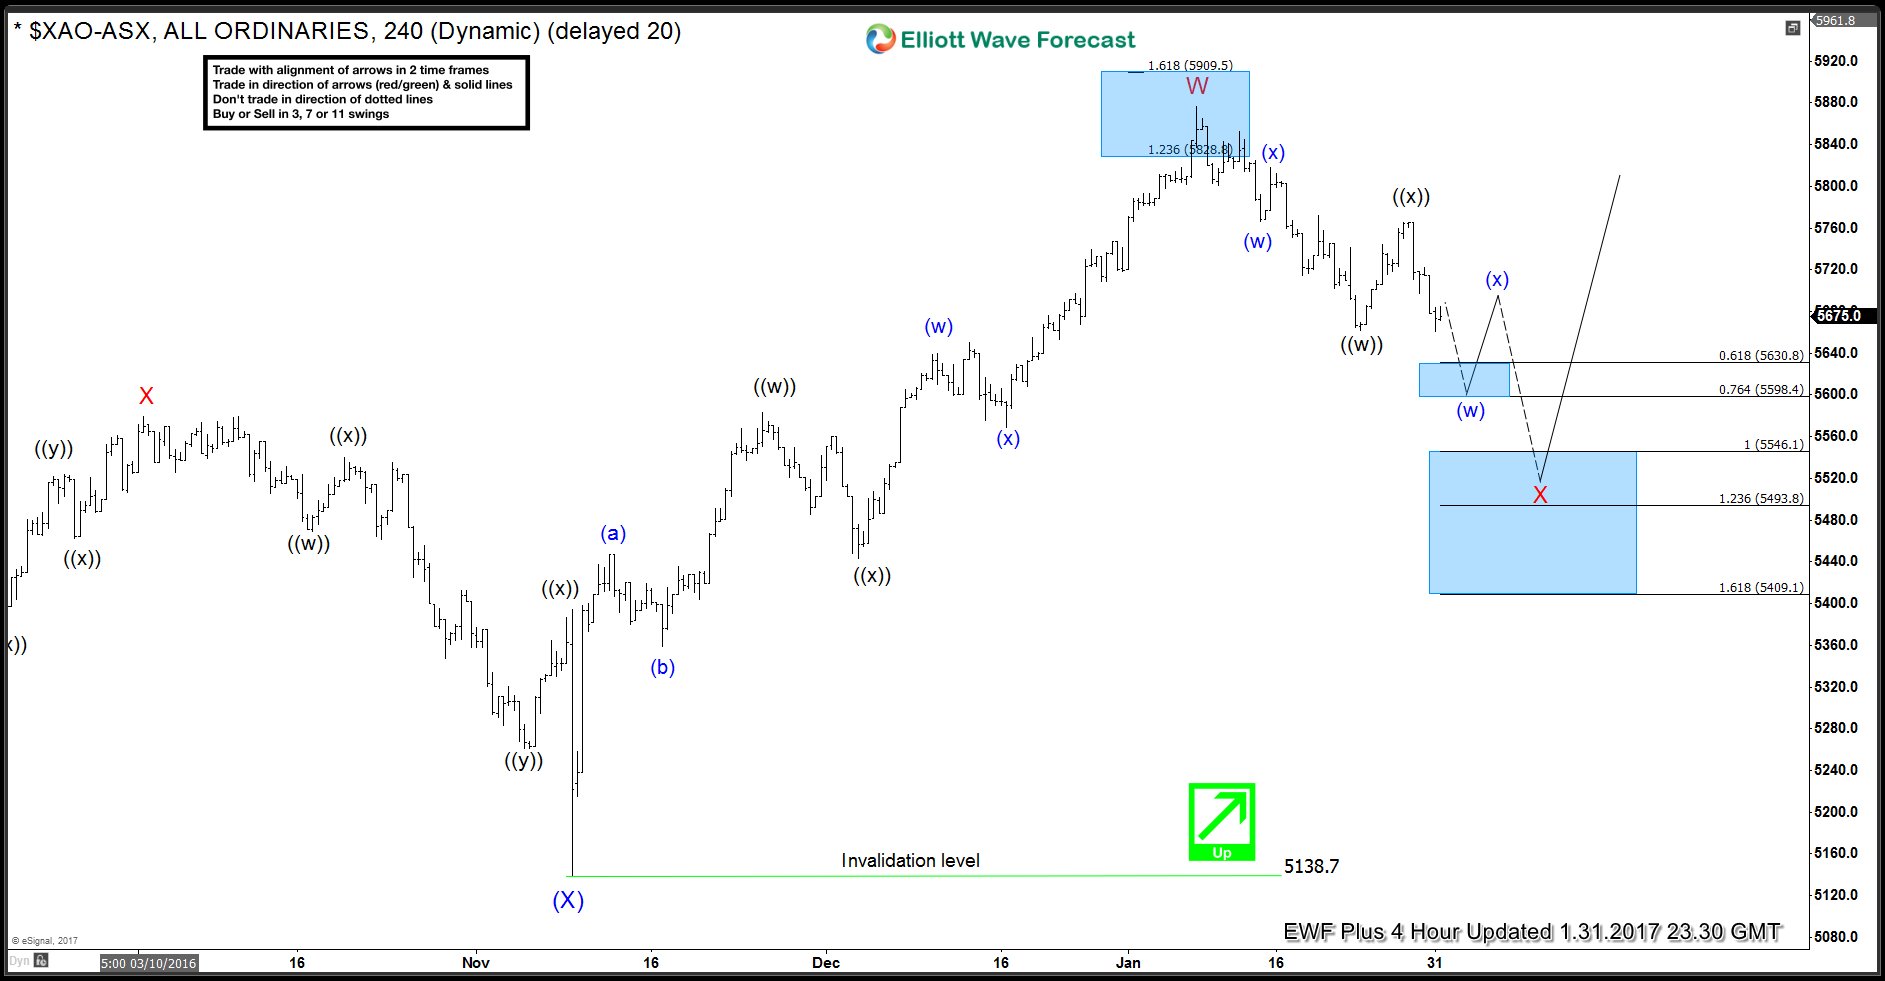
In this Technical blog we are going to take a quick look at ASX (XAO) All ordinary from Australia is correcting the cycle from November 9,2016 lows. Where as the structure from January 09,2016 peak suggesting the index has broken below the January 23 low (5661), as shown below the 4 hour chart of ASX from January 31, 2017. And has open extension lower, showing 5 swings bearish pattern from the peak. The structure from the peak looks to be overlapping, hence suggesting it’s corrective structure, either W,X,Y or W,X,Y,Z. Where first leg lower ended in wave ((w)) lower at (5661) low & wave ((x)) bounce at (5765) peak, while near term bounces fails below there index is expected to be in ((y)) leg lower & has scope to extend lower towards 5630-5598 area lower firstly to complete the minute wave (w) in blue lower for final push lower towards 5546-5493 blue box area is seen afterwards to end the cycle from January 9 peak. This is where we think buyers can jump back in the market and Index can then resume the rally for new highs above January 9 peak or make a larger 3 wave bounce at least.
ASX 4 Hour Chart
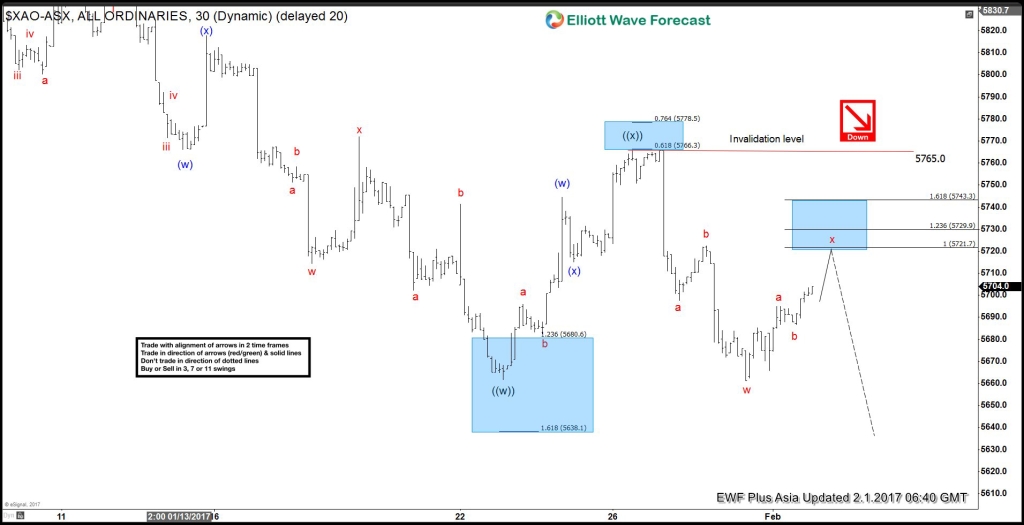
Below is the 1 hour Asia chart from 2/1/2017: suggesting index is doing 3 swings bouncing in minute “x” wave in red bounce to correct the cycle from 5765 peak towards 5721-5743 blue box area, where it is expected to get rejected for continued weakness or for 3 swings pullback at least. Note that if it manages to break 5765 peak then possibility is it could turn into a flat correction in wave ((x)) still.
ASX 1 Hour Chart
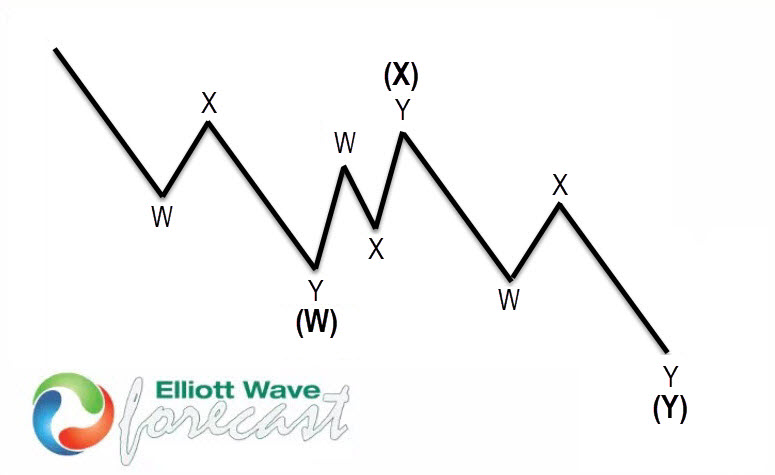
Anyone of you, who is not familiar with W,X,Y ( Double three structure ) here’s some explanation:
The double three is the most important pattern in the new Elliott wave theory and probably the most common pattern on the market these days, also known as 7 swing structure. It is a very reliable pattern that is giving us good commercial entries with clearly defined invalidation levels and target areas. The image below shows what Elliott Wave Double Three looks like. It has (W), (X), (Y) tagging and internal structure 3,3,3, which means that all 3 legs are corrective sequences. Each (W) and (Y) are made of 3 swings, have structure W, X, and Y to a lesser extent.
if you enjoyed this article, feel free to try our Free 14 day trial . we provide Elliott Wave charts in 4 different time frames, up to 4 times a day update in 1 hour chart, two live sessions by our expert analysts, 24 hour chat room moderated by our expert analysts, market overview, and much more! Try us out for Free 14 day trial & starts making profits with us.
Back


