Greetings, traders! In this Apple Elliott Wave Analysis, we’ll delve into our application of the Elliott wave theory once again. We will recall our forecast of a near-term low for Apple stock just before the significant surge occurred. Our analysis revealed that Apple stock underwent a bearish impulse cycle from December 14, 2023, to January 19, 2024. Afterward, it initiated a recovery phase. We anticipated this recovery to manifest either as an A-B-C or a W-X-Y corrective structure before the resumption of the bearish cycle from December 14, 2023, ensued, outlining our medium-term forecast for the stock.
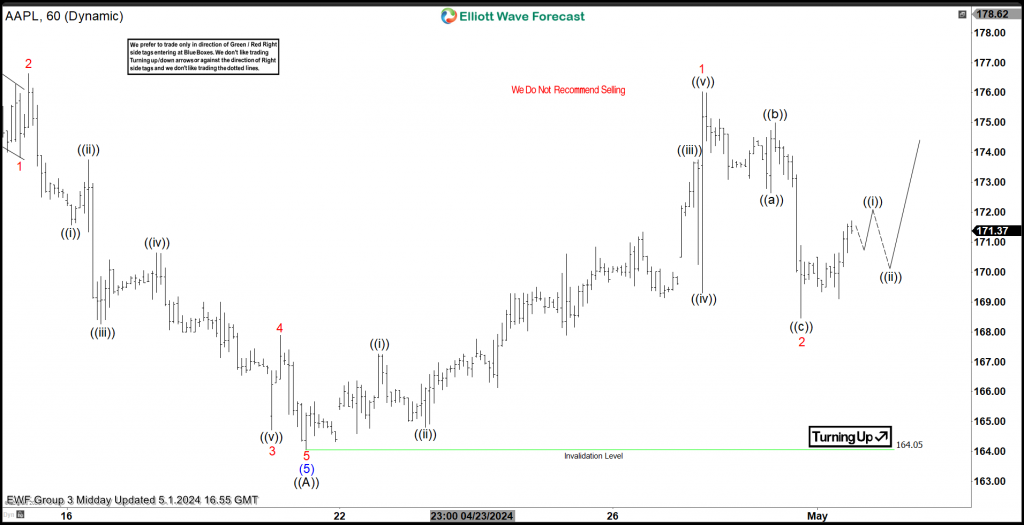
Apple Elliott Wave Analysis – 05.01.2024
To ensure our members remain abreast of the market dynamics following the January 19, 2024, low, we provided our routine four-times-a-day 1-hour updates along with an end-of-day H4 update on AAPL and the 77 other instruments within our coverage. On May 1, 2024, during the midday New York update, we shared the chart above. This update illustrated the anticipated bearish impulse, denoted as wave ((A)). Price is reacting accordingly with an impulse – minor degree wave 1 of (A) of ((B)).
Subsequently, a wave 2 retracement followed, which we identified as completed. Afterward, wave 3 commenced with its initial sub-wave – wave ((i)). Based on all these, we projected the near-term trajectory for Apple Stock Elliott Wave Analysis to be bullish. This will be true as long as the 164.05 low remained intact. Consequently, we anticipated buyers to enter the market upon the conclusion of wave ((ii)). Thereafter, wave 3 should propel above the previous wave 1 high from April 29, 2024.
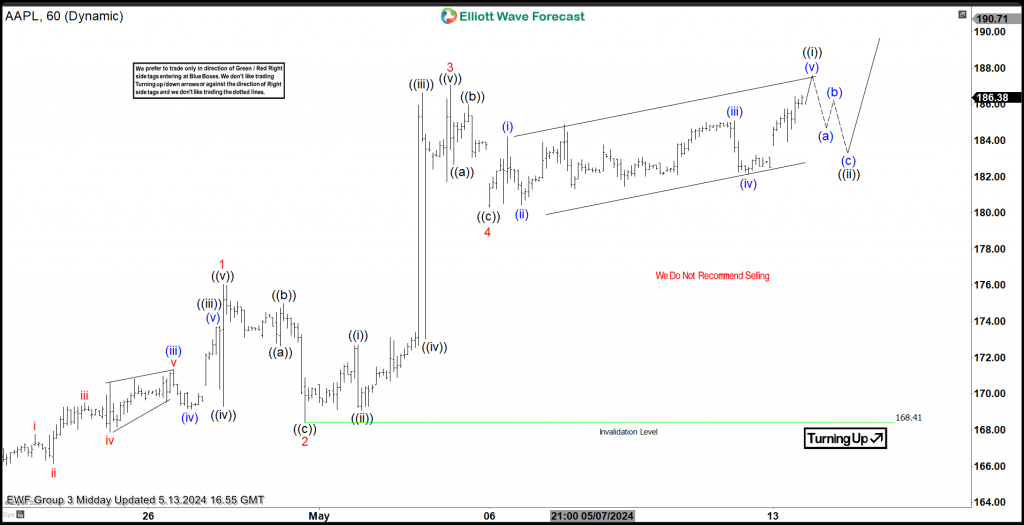
Elliott Wave Analysis Apple Stock Forecast – 05.13.2024
The update shared with members on May 13, 2024, highlighted how the price rallied since May 1, 2024. Subsequently, wave 3 was completed at the high of May 3, 2024, followed by a dip in wave 4. Wave 4 is completed and the price is already reacting upwards for wave 5. Thus, the outlook for Apple Stock Elliott Wave Analysis remains favorable for buyers.
About Elliott Wave Forecast
www.elliottwave-forecast.com updates one-hour charts 4 times a day and 4-hour charts once a day for all our 78 instruments. We do a daily live session where we guide our clients on the right side of the market. In addition, we have a chat room where our moderators will help you with any questions you have about what is happening in the market.
Moreover, experience our service with a 14-Day Trial for only $9.99. Cancel anytime by contacting us at support@elliottwave-forecast.com

