In this Technical blog, we are going to take a quick look at the past 1 hour Elliott Wave performance of AAPL stock. Which we presented to our clients at elliottwave-forecast.com. We are going to explain the structure from 6/29 low (141.70) cycle below.
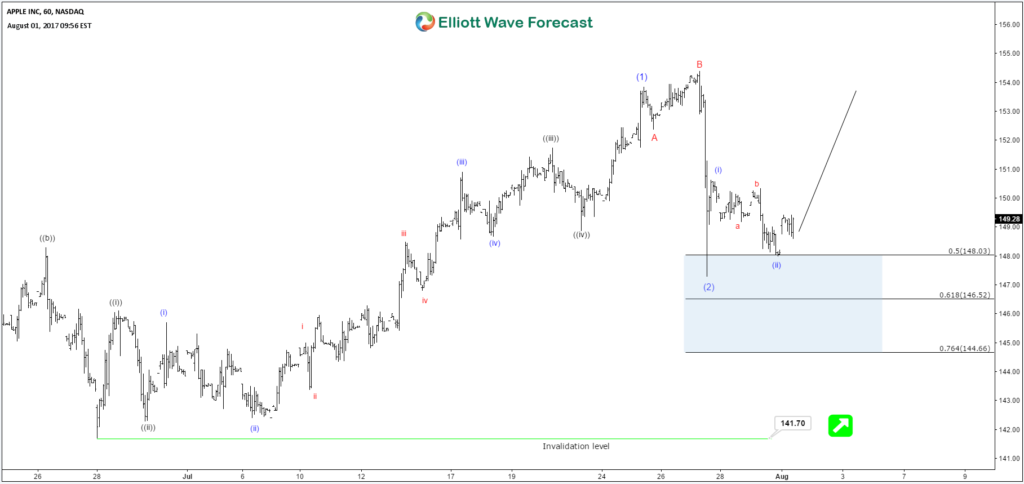
AAPL 1 Hour Elliott Wave Chart 8.1.2017
The cycle from 141.70 showed the 5 waves structure suggested that the cycle from there could be following a zigzag pattern or could be following larger diagonal structure. There’fore, the stock was expected to find the buyer’s from 50-0.764% Fibonacci retracement area (148.03-144.66) of the cycle from 141.70 low.
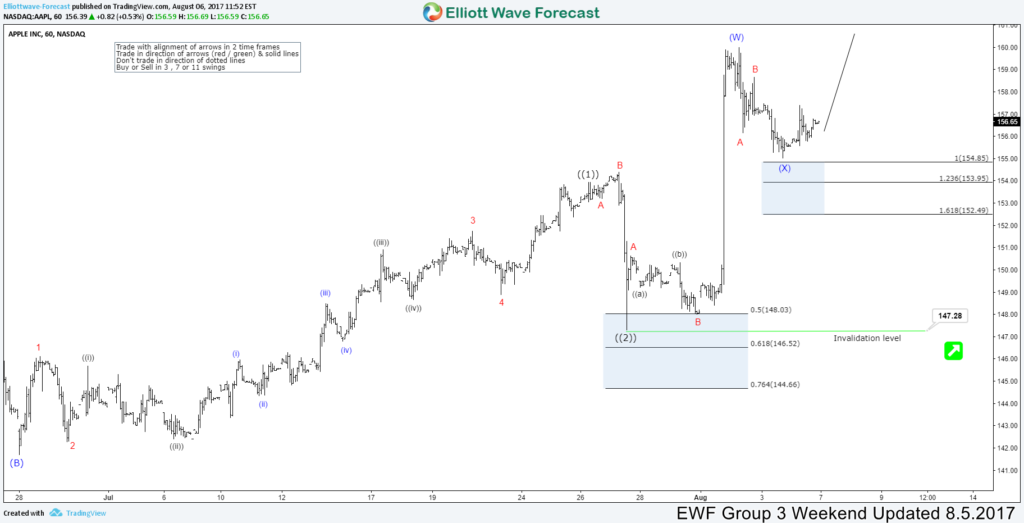
AAPL 1 Hour Elliott Wave Chart 8.5.2017
The stock found the buyer’s as expected in between 50-0.764% Fibonacci retracement area (148.03-144.66) and ended the dip as a flat correction at 147.28 low. And broke to new highs started showing corrective sequence thus suggesting that stock was following a diagonal structure from June 29 low (141.70). After seeing a break higher, the stock started showing bullish sequence from June 29 low and dips offered us a buying opportunity against 147.28 low in the first degree. Note: we adjusted the degree of a count from June 29 low in the middle.
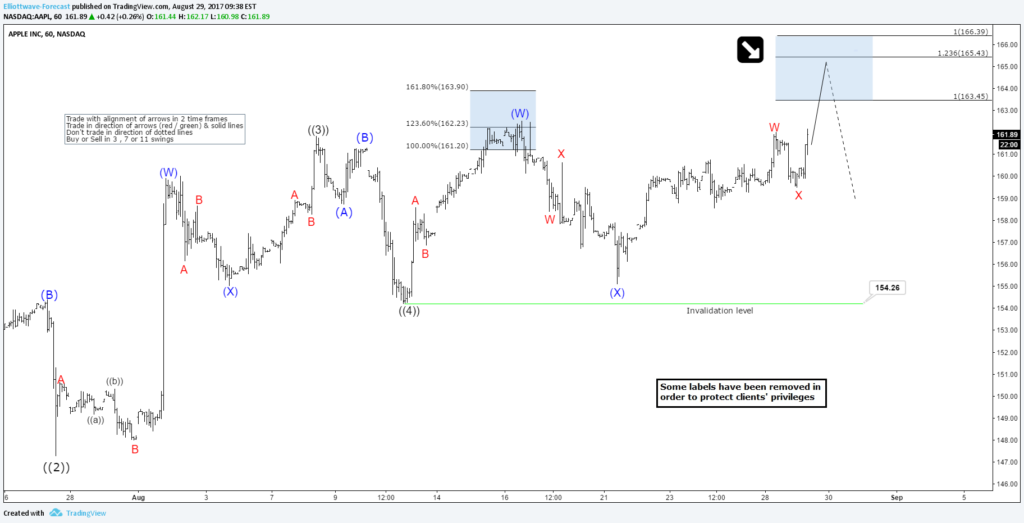
AAPL 1 Hour Elliott Wave Chart 8.29.2017
The stock showed the strength as expected and moved higher against 147.28 low. The wave ((4)) of a diagonal ended at 154.26 and made a new high by maturing June 29 cycle in a diagonal. However, it was expected to do another push higher towards 163.45-165.43 100%-123.6% Fibonacci extension area of intermediate (W)-(X) trading against 154.26 low before ending the primary cycle from June 29.
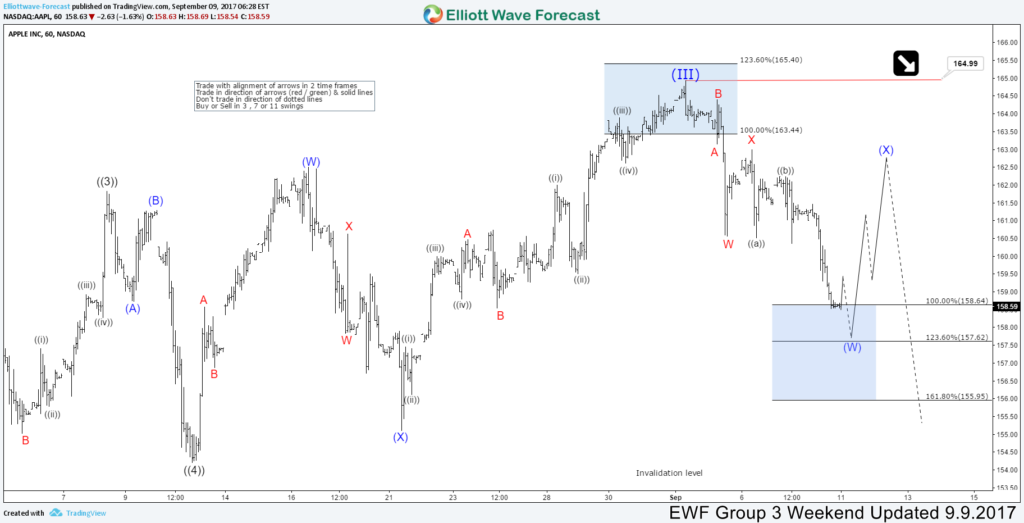
AAPL 1 Hour Elliott Wave Chart 9.9.2017
The stock completed 5 waves diagonal structure in between 163.45-165.43 100%-123.6% Fibonacci extension area as expected and formed the temporary peak at 164.99 on September 01. The stock started correction against June 29 cycle and was expected to buy in the sequence of 3, 7 or 11 swings. Initially, the stock was expected to end the 3 swings of the correction in between 158.64-155.95 100%-1.618% Fibonacci extension area of W-X. And find a buyer’s there for a 3 wave bounce minimum.
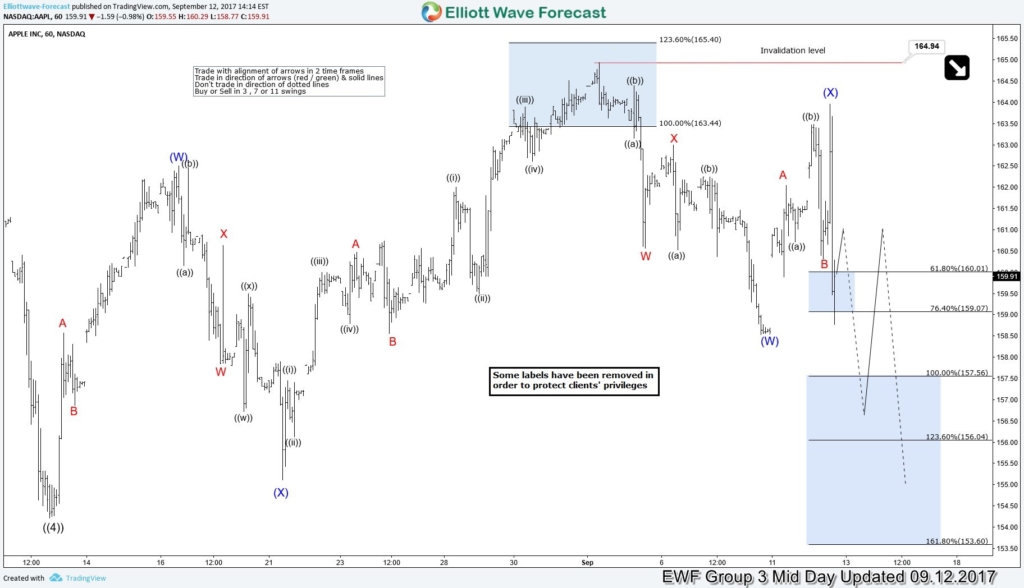
AAPL 1 Hour Elliott Wave Chart 9.12.2017
The stock gave us the 3 wave reaction higher as expected to allow members to scale in some profits in a 3 wave bounce. However, it was expected to do the double correction against 9/01 peak 164.99 based on correlation with other technology stocks before renewing the trend to the upside. There’fore our strategy remained to buy the stock on the dips.
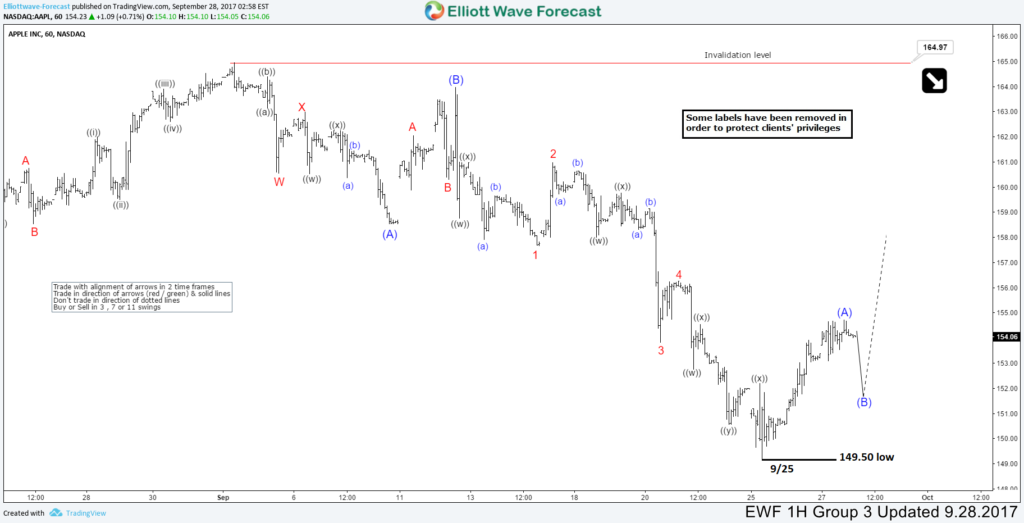
AAPL 1 Hour Elliott Wave Chart 9.28.2017
Afterwards, the stock extended the correction from September 01 peak 164.99 in an expanded flat correction. Which ended the cycle from the peak on 9/25 low at 149.50 and start bouncing higher. Currently, the stock is already into new highs and started the next extension higher. If interested in latest 1hr, 4hr, Daily & Weekly path then Try 14-day Free Trial & get the latest market update in AAPL & other stocks.
Back
